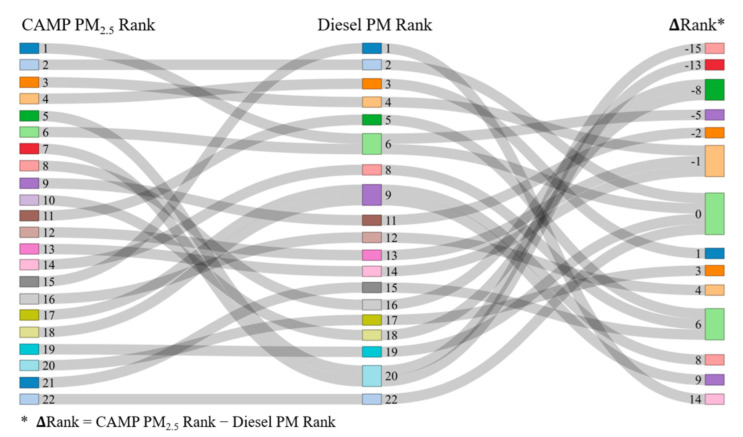
Figure 7.
The rank difference between the CAMP PM2.5 rank and the diesel PM rank of the 22 households. Each line represents one household. Households ranking at the top were exposed to higher ambient PM2.5 or diesel PM emissions; households ranking at the bottom were exposed to lower ambient PM2.5 or diesel PM emissions.

