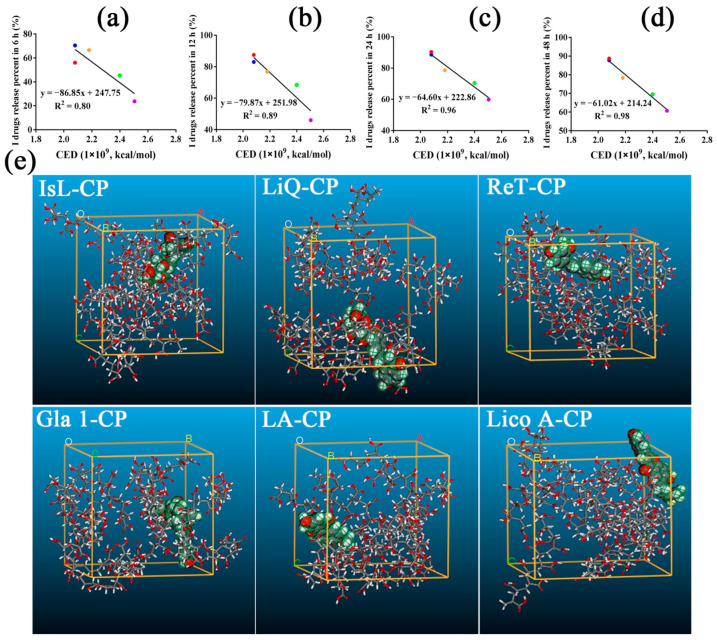
Figure 8.
The correlation between I drugs release percent in 6 h (a), 12 h (b), 24 h (c), 48 h (d) and CED values of I drugs-CP binary systems, respectively (The red, blue, yellow, green and purple dots represented IsL, LiQ, LiQT, LB and ReT respectively). (e) Snapshots of systems at the end of the MD (drug: CPK model, taking IsL-CP, LiQ-CP, ReT-CP, Gla 1-CP, LA-CP and Lico A-CP as examples).

