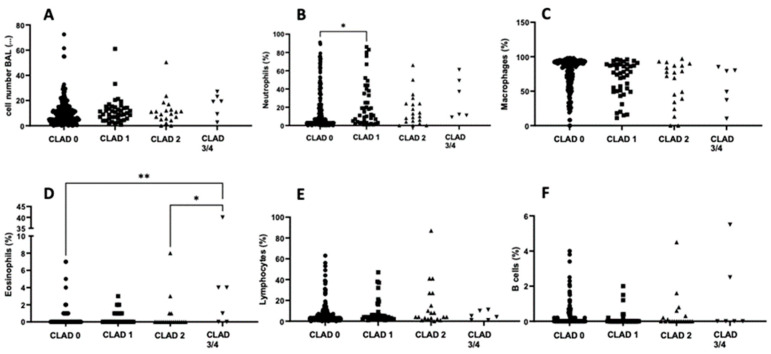
Figure 2.
Cellular distribution of BAL fluid among the different CLAD stages. Scatterplots showing the cellular distribution of the analyzed BAL fluid for each CLAD stadium: cell number (A), proportion of neutrophils (B), macrophages (C), eosinophils (D), lymphocytes (E), and B cells (F). * = p < 0.05; ** = p < 0.01. Abbreviations: BAL = Bronchoalveolar Lavage; CLAD = Chronic Lung Allograft Dysfunction.

