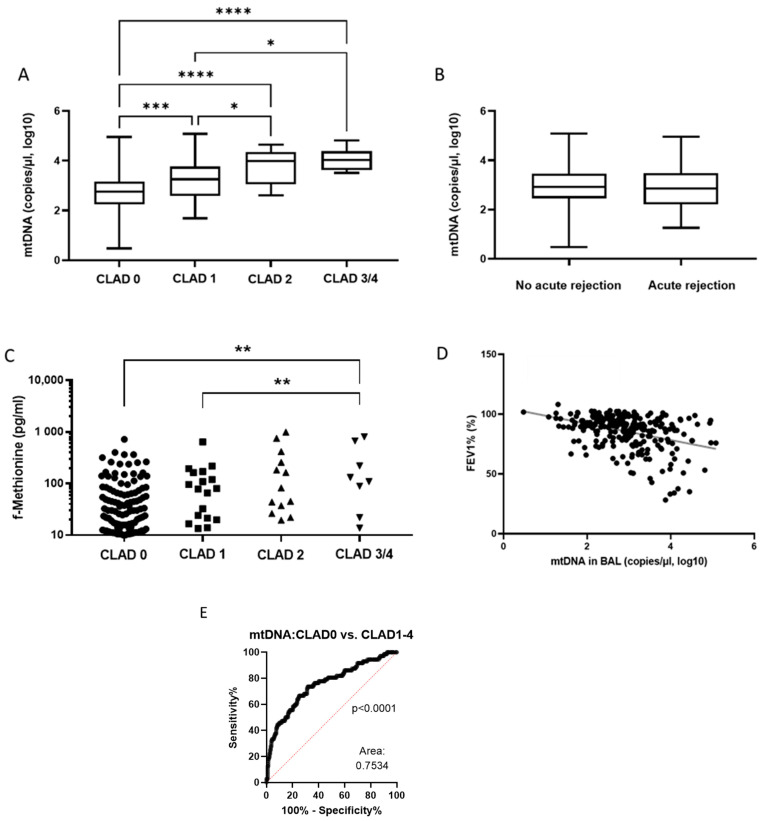
Figure 4.
Diagrams showing the relationship between concentrations of ND1-mtDNA (A) and f-Met (C), and CLAD stage. Boxplot comparing ND1-mtDNA concentration with the status of acute rejection (B). Scatterplot showing the correlation between the concentration of ND1-mtDNA and FEV1 (D). A ROC analysis of the predictive power of ND1-mtDNA concentration for CLAD status (E). * = p < 0.05; ** = p < 0.01; *** = p < 0.001; **** = p < 0.0001. Abbreviations: CLAD = Chronic Lung Allograft Dysfunction; FEV1 = Forced Expiratory Volume in 1 second; mtDNA = mitochondrial DNA.

