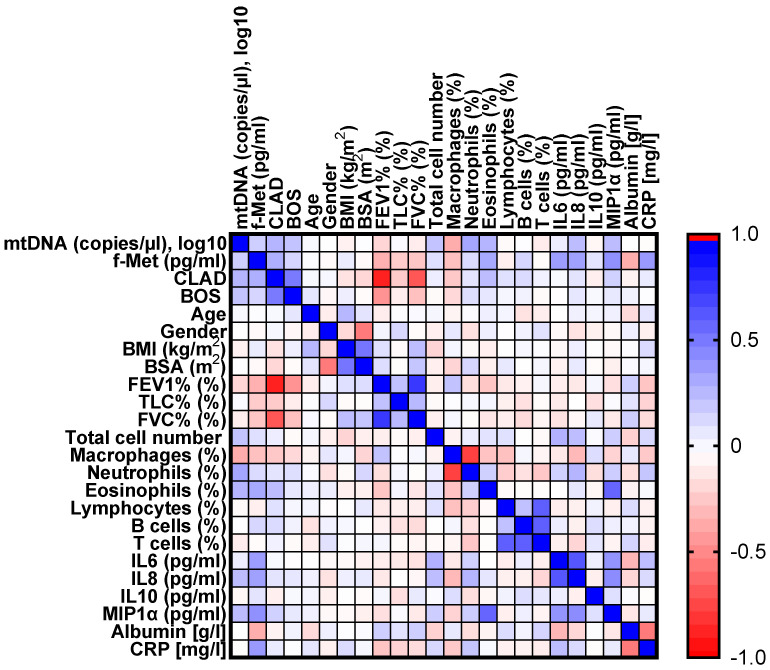
Figure 5.
Heatmap of the Pearson correlation matrix. The color depth represents the strength of the correlation between each pair of parameters considered. Blue represents a positive correlation, and red represents a negative correlation. Abbreviations: BMI = Body Mass Index; BOS = Bronchiolitis Obliterans Syndrome; BSA = Body Surface Area; CLAD = Chronic Lung Allograft Dysfunction; C-Reactive protein; FEV1 = Forced Expiratory Volume in 1 second; f-Met = formyl-methionine; FVC = Forced Vital Capacity; IL = Interleukin; MIP1⍺ = Macrophage Inflammatory Protein-1; mtDNA = mitochondrial DNA; TLC = Total Lung Capacity.

