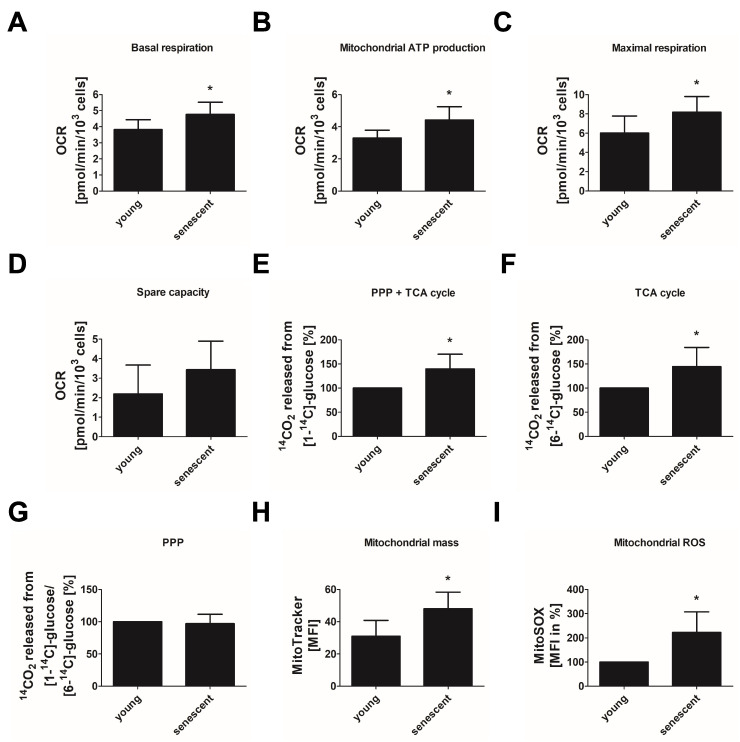
Figure 3.
Increased oxidative phosphorylation in replicative senescent endothelial cells. Oxidative glucose metabolism and mitochondrial parameters were analyzed in HUVEC of passage 1 (P1, young) and passage 20–25 (P20–25, senescent). (A–D) Mito stress test: basal respiration (A), mitochondrial ATP production (B), maximal respiration (C), and spare capacity (D) as calculated from oxygen consumption rates (OCR) measured via Seahorse technology at baseline and after sequential addition of pharmacological agents (oligomycin, an inhibitor of ATP synthase; carbonyl cyanide-4-(trifluoromethoxy)phenylhydrazone (FCCP), a mitochondrial uncoupling agent; antimycin A, an inhibitor of the respiratory chain complex III) (n = 6 (P20–25), n = 8 (P1), * p < 0.05, unpaired Student’s t-test). (E) Tricarboxylic acid (TCA) cycle and pentose phosphate pathway (PPP) activity as calculated from the amount of 14CO2 released from [1-14C]-glucose. (F) TCA cycle activity as calculated from the amount of 14CO2 released from [6-14C]-glucose. (G) PPP flux depicted as ratio between 14CO2 released from [1-14C]-glucose and 14CO2 released from [6-14C]-glucose. All radioactive values were normalized to the amount of proteins of equally treated samples. Data obtained for P20–25 are shown as percentage of P1 data (n = 6, * p < 0.05, one-sample t-test). (H) Mitochondrial mass depicted as relative median fluorescence intensity (MFI) of MitoTracker staining analyzed by flow cytometry (n = 5, * p < 0.05, unpaired Student’s t-test). (I) Mitochondrial reactive oxygen species (ROS) displayed as relative MFI of MitoSOX analyzed by flow cytometry and normalized to P1 control (n = 5, * p < 0.05, one-sample t-test). All data represent mean + SD.

