Figure 1.
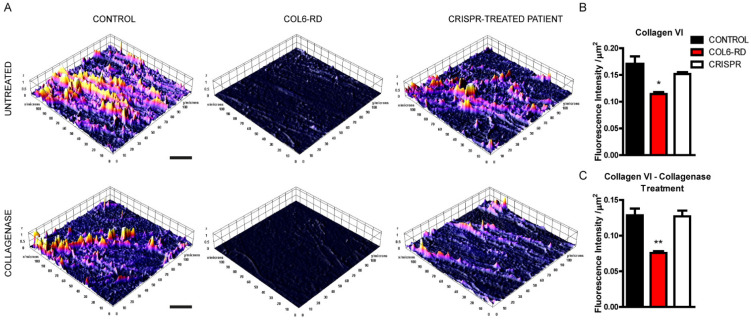
Altered extracellular matrix in cultured COL6-RD patient-derived fibroblasts. (A) Representative 3D surface plot generated from the STED images (Figure S1) of the extracellular collagen VI matrix in untreated (upper panel) and collagenase-treated (lower panel) controls, patients, and CRISPR-treated fibroblasts showing the COL6 fluorescence levels. Fluorescence intensity analysis was also quantified in untreated (B) and collagenase-treated (C) samples. Data are expressed as the mean ± SEM; n = 3; independent primary cell preparations (30 images of 8–10 stacks for each CONTROL, COL6-RD, and CRISPR samples) were used for all panels. * p < 0.05, ** p < 0.01; one-way ANOVA/Bonferroni’s multiple comparison test. Scale bar 5 µm.

