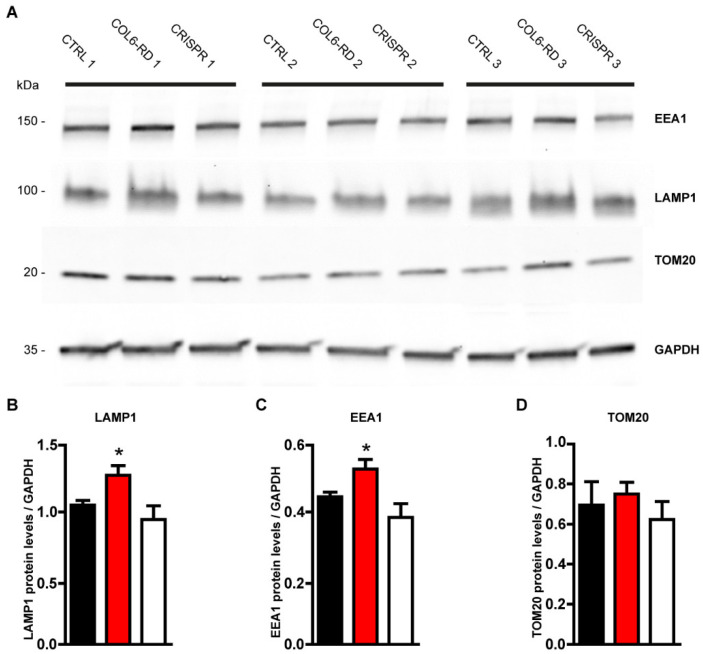
Figure 4.
Biochemical confirmation of the intracellular phenotypes observed with super-resolution microscopy. (A) Primary fibroblast homogenates from control and COL6-RD patients and CRISPR-treated COL6-RD patient-derived fibroblasts were subjected to Western blotting using antibodies against Lamp1, EEA1, and Tom20 as shown. The GAPDH marker was used as the loading control. (B) Quantification of Lamp1 from the three phenotypes. (C) Total quantification of EEA1 from the three phenotypes. (D) Total quantification of Tom20 from all the samples. Data are expressed as the mean ± SEM; n = 3; independent primary cell preparations were used for all panels. * p < 0.05; one-way ANOVA/Bonferroni’s multiple comparison test.

