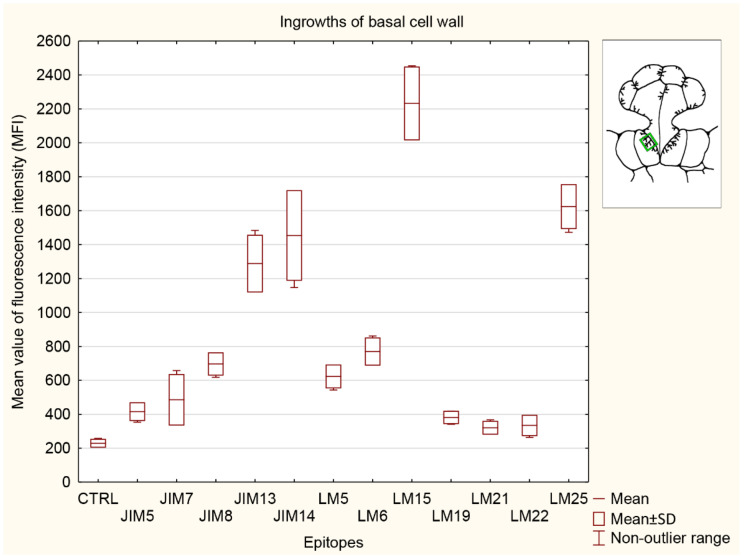
Figure 10.
Quantification of immunofluorescence labeling for ingrowths of basal cell wall. Mean values of AGP fluorescence intensity (MFI) for negative control reaction (CTRL) and for labeled AGPs (JIM14, JIM8, and JIM13 epitopes), pectins (JIM5, JIM7, LM5, LM6, and LM19 epitopes), hemicelluloses (LM 15 and LM25 epitopes), and heteromannans (LM21 and LM22 epitopes) in 3 glands from 3 different traps (n = 3).

