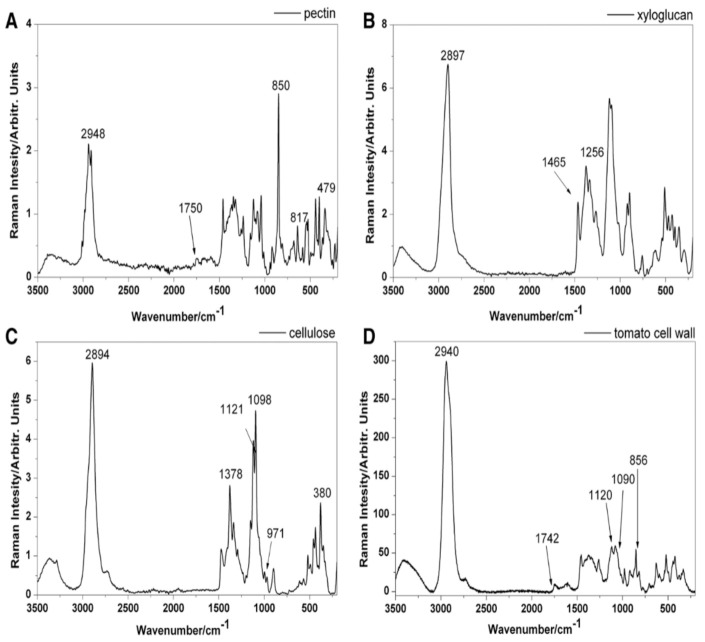
Figure 1.
Raman spectra of the pure cell wall components (laser with green light at λ = 532 nm, with a power of 10 mW, the spectra were recorded within the range of 3500–150 cm−1): pectin (A), xyloglucan (B), cellulose (C), and the Raman spectrum of the tomato cell wall (D). Copyright Plant Methods 2014.

