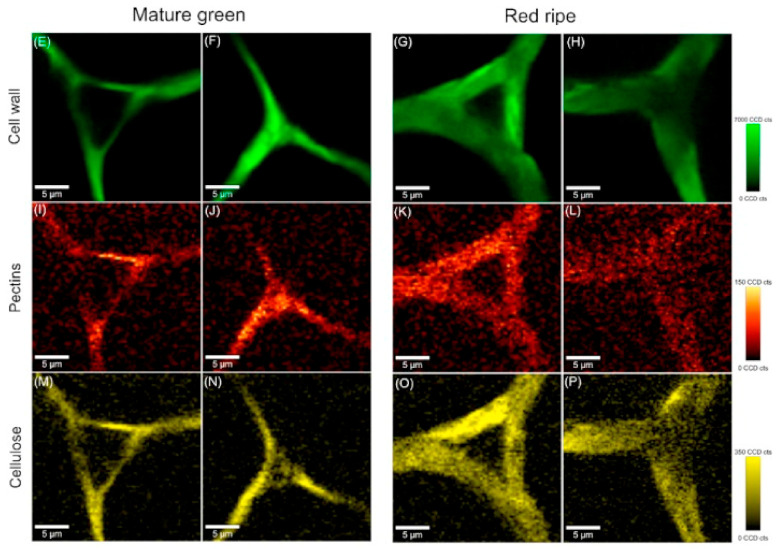
Figure 3.
Raman images of cross sections of tomato cell wall from mesocarp at laser with green light (λ = 532 nm); a power of 25 mW and integration time at 0.1 s was chosen. Raman images of all primary cell wall polysaccharides at 2936 cm−1, γ(CH) (E–H). Raman images of pectin at 854 cm−1, the (COC) skeletal (I–L). Raman images of cellulose at 1096 cm−1 and 1115 cm−1 (glycosidic bond) (M–P). Copyright Plant Physiology and Biochemistry 2017.

