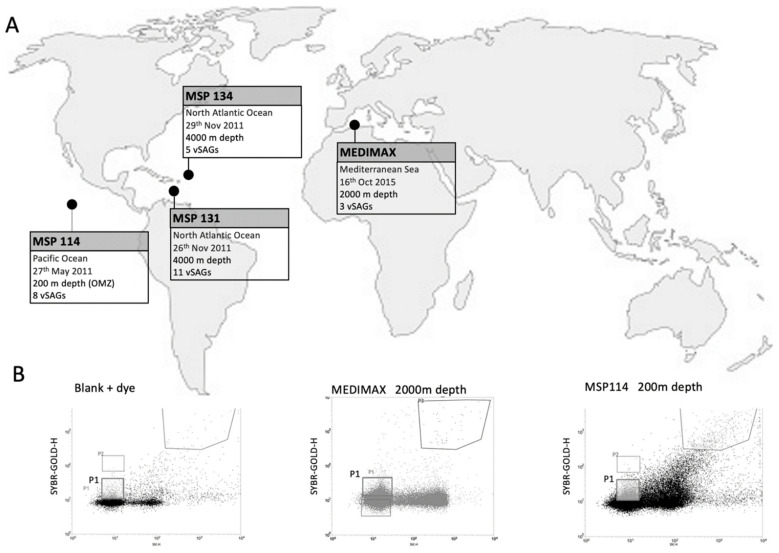
Figure 1.
(A) Sampling information map. Location, date, depth and number of viral single amplified genomes (vSAGs) are indicated for each sampling point. (B) Flow cytometry sorting plots and gates for blanks (left panel; SYBR Gold-stained buffer TE), 2000 m depth MEDIMAX (middle panel), and MSP114 200 m depth (right panel; OMZ) samples. P1 gate, which shows the viral population, was employed to sort the single viruses employed in this study.

