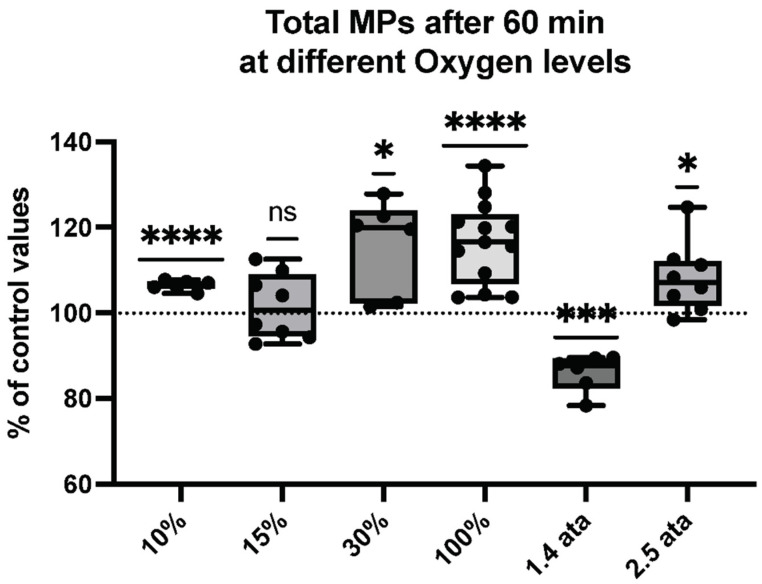
Figure 1.
Total microparticle response following different oxygen levels. Box and Whisker plots indicating median, 1st quartile, 3rd quartile, interquartile range, min., and max. in comparison to baseline (before oxygen exposure), which was set at 100%. (One-sample t test: **** p < 0.0001, *** p < 0.001, * p < 0.05, ns = non-significant).

