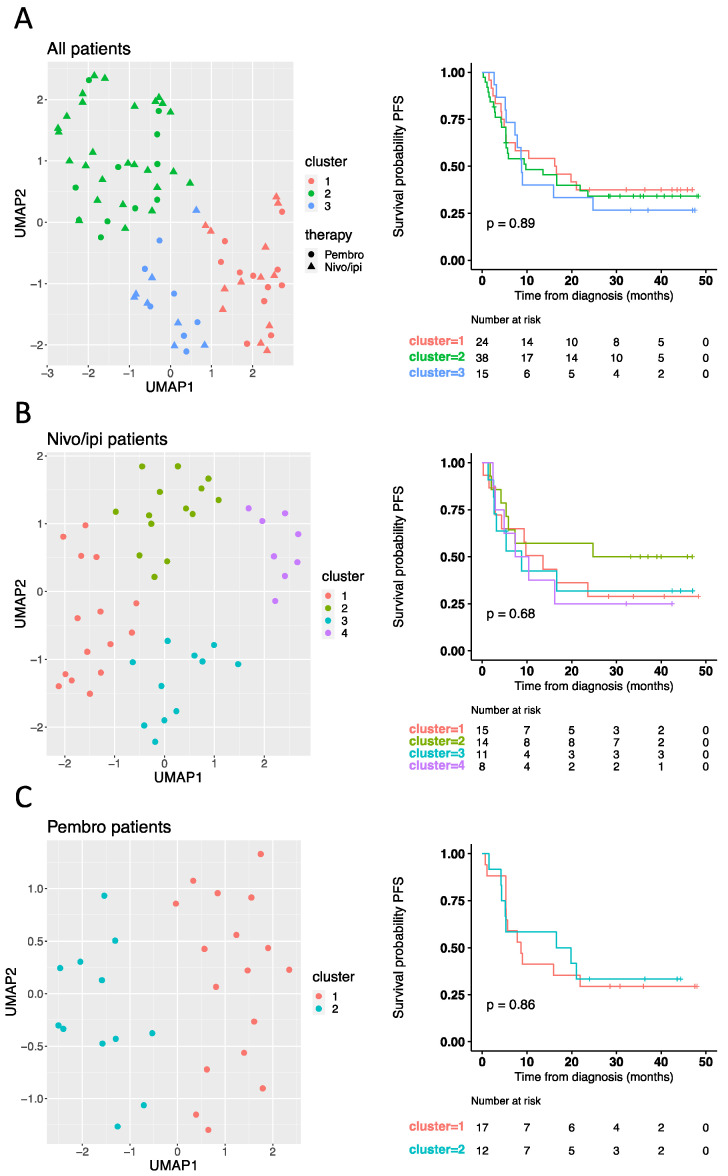
Figure 1.
Baseline cytokine signature does not predict response to checkpoint inhibitors. Plasma levels of PD1, PD-L1, IFNγ, IFNβ, IL6, IL8, IL10, CCL20, CXCL5, CXCL10, MCP1, and TNFα were measured in baseline samples from all patients (n = 77). UMAP analysis based on all 12 cytokines was performed to visualize the distribution of all patients (A, left panel), nivo/ipi patients only (n = 48) (B, left panel), and pembro patients only (n = 29) (C, left panel), followed by k-means clustering analysis to divide patients into clusters. Clusters are represented by colors (A–C), whereas the shape of the points represents first-line therapy (A). (A–C, right panel) Kaplan-Meier curves showing the percentage of progression-free survival (PFS) by cytokine profile defined clusters. Statistical significance was tested with a log-rank test. Nivo/ipi, nivolumab plus ipilimumab; pembro, pembrolizumab.

