. 2022 Jul 13;11:e76339. doi: 10.7554/eLife.76339

Figure 1. Phenotypic characterization of virus-specific CD4+ T cells by spectral flow cytometry.

Spleen GP66:I-Ab+ CD4+ T cells were analyzed 7 and 21 days after infection with LCMV Armstrong and Clone 13. (A) Schematic of experimental procedures. Uniform Manifold Approximation and Projection (UMAP) visualization was calculated based on the expression of 14 markers on virus-specific CD4+ T cells pooled from 5 animals. (B) Expression of selected markers shown on the UMAP as in (A). (C) CD4+ T cells from each condition were highlighted as contour lines on the UMAP. Experiment with 4–5 mice per group, representative of two independent experiments. See also Figure 1—figure supplement 1 for spectral cytometry analysis including GP33:H2Db+ CD8+ T cells, and for surface marker panels used to characterize T cell populations.

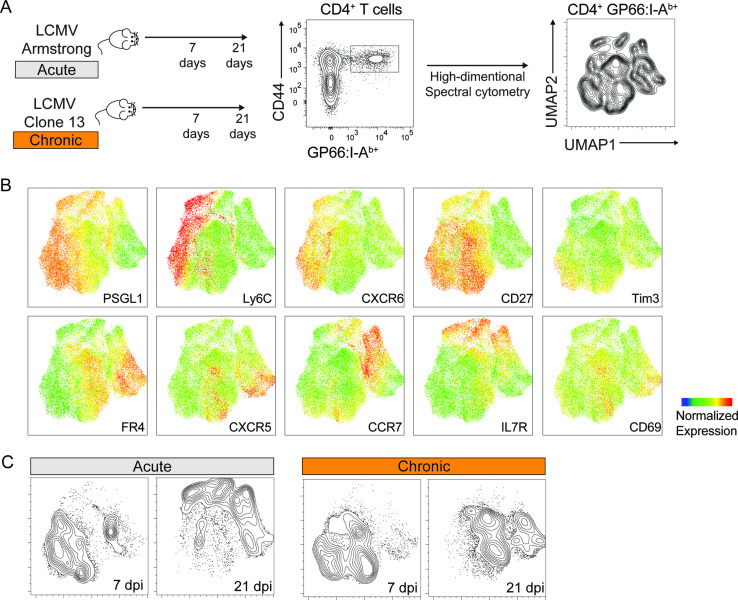
Figure 1.

Figure 1—figure supplement 1. Phenotypic characterization of virus-specific T cells.

Figure 1—figure supplement 1.

Spleen GP66:I-Ab+ CD4+ and GP33:H2Db+ T cells were analyzed 7 and 21 dpi after infection with LCMV Armstrong and Clone 13. (A) UMAP was calculated based on the expression of 14 markers on virus-specific T cells. (B) CD4, CD8 and tetramer levels shown on the UMAP as in (A). (C) Expression of 14 parameters used to generate the UMAP. (D) T cells from the indicated conditions were projected on the UMAP. Experiment with 4–5 mice per group, representative of two independent experiments. (E) Percentage of the main CD4+ T cell states defined by scRNA-seq and spectral cytometry (Flow). Populations in spectral cytometry (see also Figure 1) were defined with the following surface markers: Th1 Effector: PSGL1high CXCR6high Ly6chigh/int; Th1 Memory: PSGL1high CXCR6high Ly6chigh/int IL7Rhigh; Tfh Effector: PSGL1low CXCR5high Ly6cneg, Tfh Memory; PSGL1low CXCR5high Ly6cneg CD27low; Tcmp/Tcm: CCR7high.