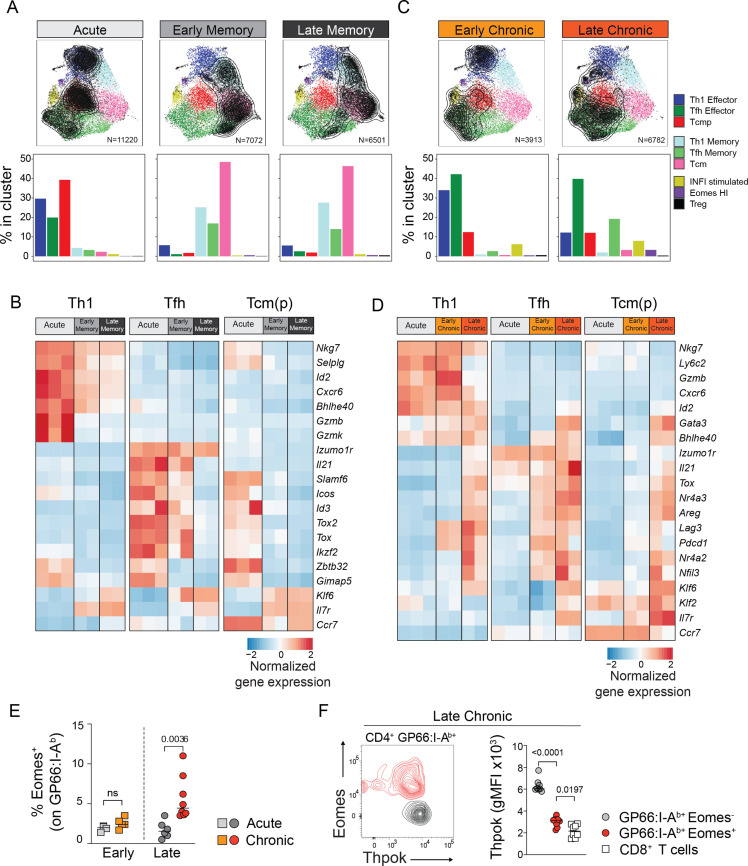
Figure 3. Subset-specific adaptation of CD4+ T cell states in chronic and acute infections.
(A,C) Distribution of T cell states at different timepoints after acute and chronic infections. In the UMAP plots, contour lines indicate the density of T cells for each type of infection and timepoint; the barplots in the bottom row indicate the percentage of cells in each subtype in the indicated condition. (B,D) Normalized average expression during acute and chronic infections among Th1, Tfh and Tcm(p) subtypes. Selected genes from differentially expressed genes shown in Figure 3—figure supplement 1A,C. (E,F) Animal were infected with LCMV Armstrong (Acute) or Clone 13 (Chronic) and analyzed at the indicated timepoints (Early: 7dpi; Late: 21dpi). (E) Graph shows the percentage of Eomes+ cells among spleen GP66:I-Ab+T cells. (F) Plot (left) shows the intracellular expression of Eomes and Thpok on spleen GP66:I-Ab+T cells analyzed 21 dpi after LCMV Clone 13 infection. Graph (right) shows Thpok mean fluorescent intensity (gMFI) in the indicated population. (E,F) are from one experiment with >5 mice per group, representative of 2 independent experiments.


