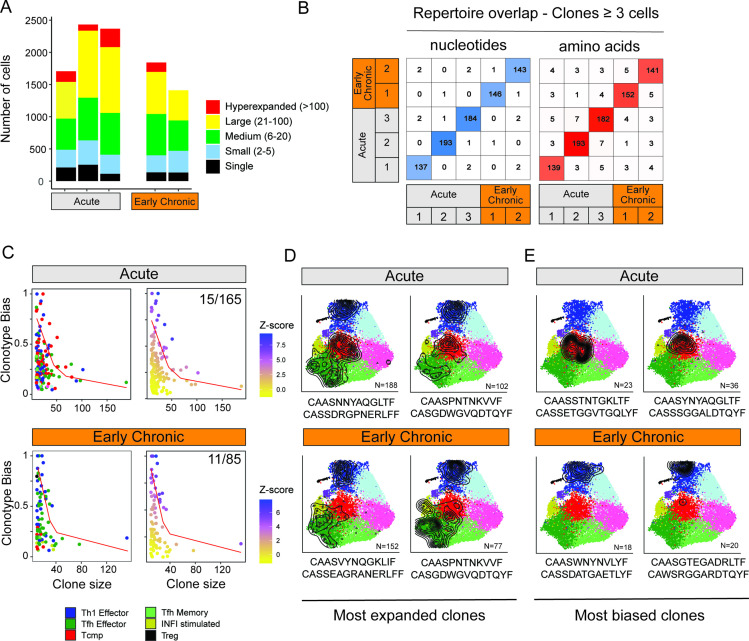
Figure 4. Clonal structure of virus-specific CD4+ T cells and clonotype-fate relationship.
(A) Fraction of clonal space occupied by clonotypes with different levels of expansion. For each sample (three replicates for Acute, two replicates for Early Chronic), the plot indicates the number of single cells that belong to clonotypes in one of the five classes of expansion. (B) Number of clones with identical CDR3 nucleotides or amino acid sequence pairs between individual samples among clonotypes with ≥3 cells. (C) Clonotype bias analysis for acute and chronic infection samples. Plots show clonotype bias vs. clonal size for all clones with >10 cells. Clonotypes are colored by predominant T cell subtype (left) or by Z-score of the clonotype functional bias (right). Red line highlights the null distribution (background distribution) for each condition. (D, E) Distribution of cells over the reference map for the (D) four most expanded and (E) four most biased clonotypes in acute and chronic infections. The CDR3 alpha and beta sequences and the clonotype size are indicated for each clonotype.


