. 2022 Jul 13;11:e76339. doi: 10.7554/eLife.76339

Figure 5. Interpretation of CD4+ T cell states in external datasets by projection into the reference map.

(A) Independent scRNA-seq datasets can be projected into the CD4+ T cell reference map using the ProjecTILs algorithm and interpreted in the context of the space and cell states of the reference. (B) UMAP embeddings for the external data by Ciucci et al., 2019 at 7 and 30 days after acute LCMV infection projected into the reference map. Contour lines indicate the density of projected cells. (C) Radar plots showing average expression profiles of a panel of CD4+ T cell marker genes, for the projected cells from Ciucci et al., 2019 (blue and red) compared to the reference map profiles (black) grouped by predicted subtype. (D) UMAP embeddings for projected scRNA-seq data of Bcl6- and Prdm1-deficient virus-specific CD4+ T cells isolated 7 days after acute infection with LCMV Armstrong (data from Ciucci et al., 2022). (E) UMAP embeddings for projected scRNA-seq data of virus-specific CD4+ T cells isolated 33 days after chronic infection with LCMV Clone13, in animals treated with anti-PDL1 or isotype control (data from Snell et al., 2021). Barplots in the bottom row indicate the percentage of cells projected in each reference subtype.

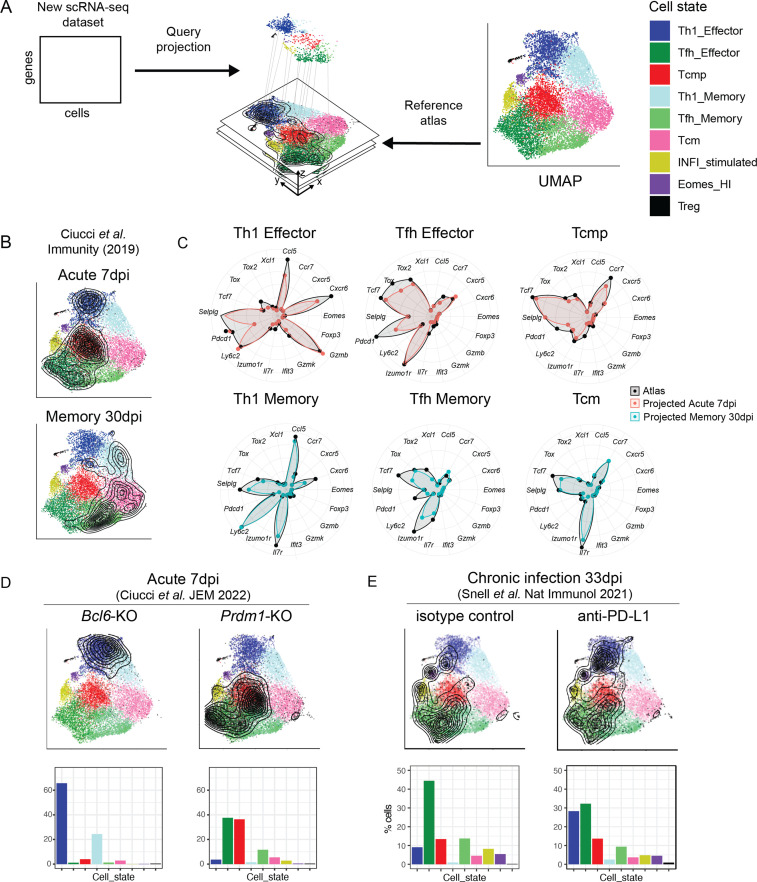
Figure 5.

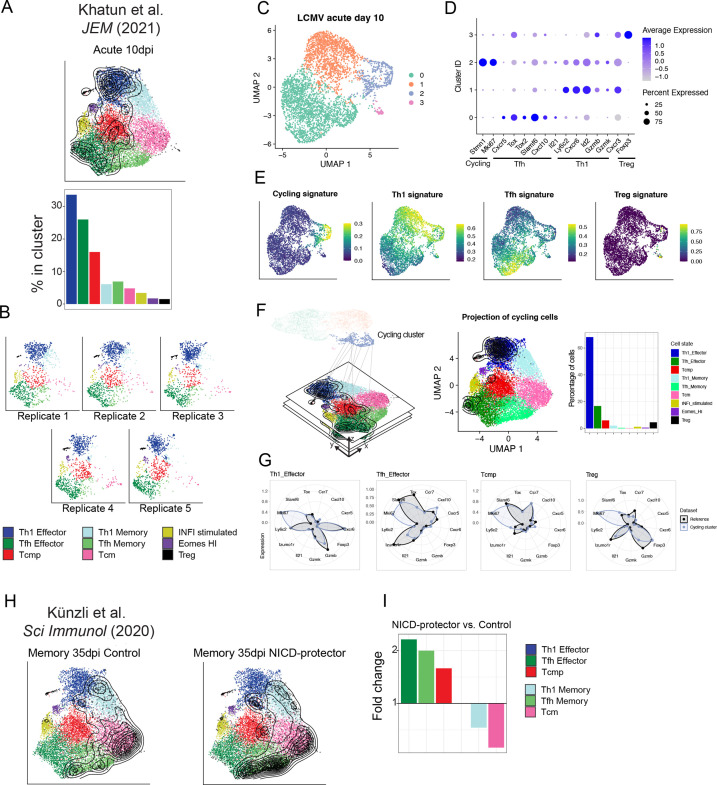
Figure 5—figure supplement 1. Reference-based classification of independent datasets.

Figure 5—figure supplement 1.

(A–G) Analysis of scRNA-seq data for virus-specific CD4 +T cell data 10 days after LCMV acute infection (Khatun et al., 2021). (A) UMAP embeddings and subtype composition after projection into the reference map. (B) Distribution of cells for five individual replicates from the same study. (C) UMAP visualization of unsupervised clustering (performed in PCA space). (D) Average expression of key markers identify a Th1 cluster (1), a cluster of cycling cells (2), a Tfh cluster (3) and a Treg cluster (4). Cycling cells in cluster 2 express a mixture of both Th1 and Tfh markers. (E) Signature scores suggest that the cycling cluster contains a mixture of multiple phenotypes (Th1, Tfh, and Treg). (F) Subtype composition of all cells in the cycling cluster after reference projection. (G) Expression profile for a panel of marker genes for projected cycling cells and for the reference map (Mki67 is a marker for cycling). (H) UMAP embeddings for the virus-specific CD4 +T cell scRNA-seq data by Künzli et al., 2020 35 days after LCMV acute infection, for NAD-induced cell death (NICD)-protector treated mice and control. (I) Fold-change for composition of CD4 +T cells states in NICD-protector vs. control sample, highlighting relative increase and decrease in the frequency of individual cell subtypes. Black contour lines in all UMAP identify the density of single cells from the projected dataset, overlaid on the space of the reference.
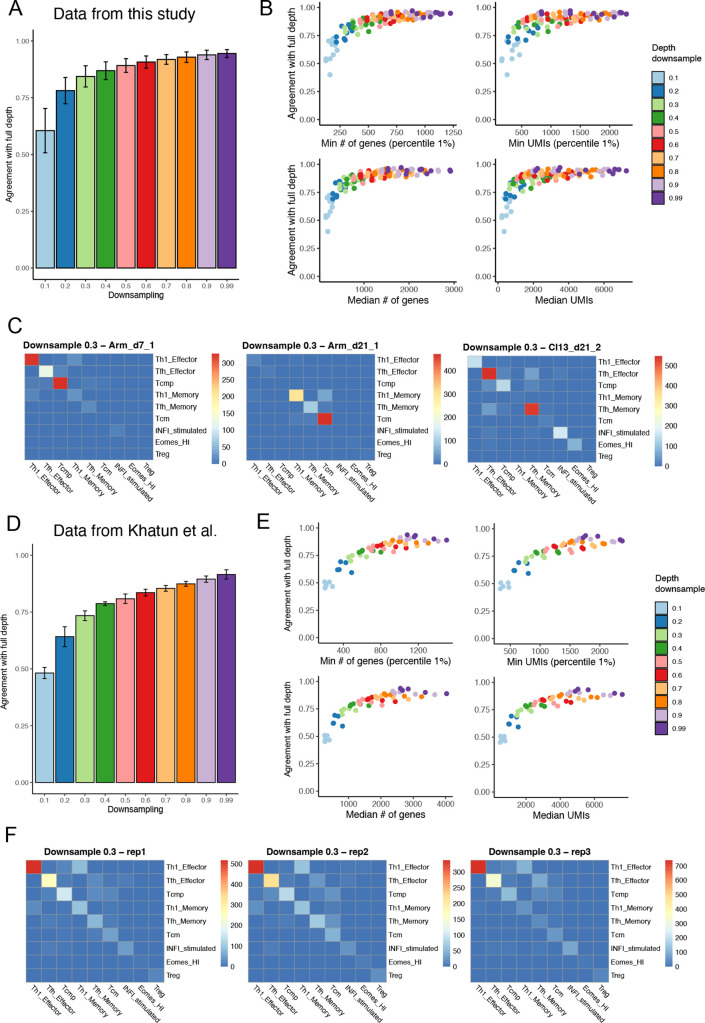
Figure 5—figure supplement 2. Effect of sequencing depth on reference-based annotation.

Figure 5—figure supplement 2.

(A) Data for each sample generated in this study were downsampled for sequencing depth and re-projected into the reference map, allowing to measure the agreement in cell type annotation between full depth and different downsampling levels (10–99%). Error bars show standard deviation across individual samples. (B) Annotation agreement between full depth and downsampled datasets as a function of minimum and median number of genes, and minimum and median number of UMIs. (C) Number of cells shared between subtypes in full-depth vs. 30% downsampled datasets, for three select samples. Off-diagonal elements represent annotation disagreement between full-depth and downsampled datasets. (D to F) Same as (A to C), using instead the five replicates of LCMV acute data from Khatun et al., 2021.
Figure 5—figure supplement 3. Reference-based analysis of CD4+ T cells in late chronic infection.

Figure 5—figure supplement 3.

(A) UMAP embeddings of projected scRNA-seq data of virus-specific (SMARTA) CD4+ T cells isolated from anti-PDL1 treated or isotype control animals with LCMV chronic infection at day 33 p.i., from the study by Snell et al., 2021. (B) Average expression profiles for a panel of marker genes in the six most represented reference cell states, for the reference and the two conditions (isotype vs. anti-PDL1 treated). (C) Average expression, normalized by row, for a panel of lineage genes and exhaustion markers in each timepoint represented by the reference map, as well as for the two projected samples. (D) Differentially expressed genes between isotype-treated and anti-PDL1-treated Th1 effector cells; red points identify genes with log2 fold-change >0.5 and p-value <10–3 (Wilcoxon test).