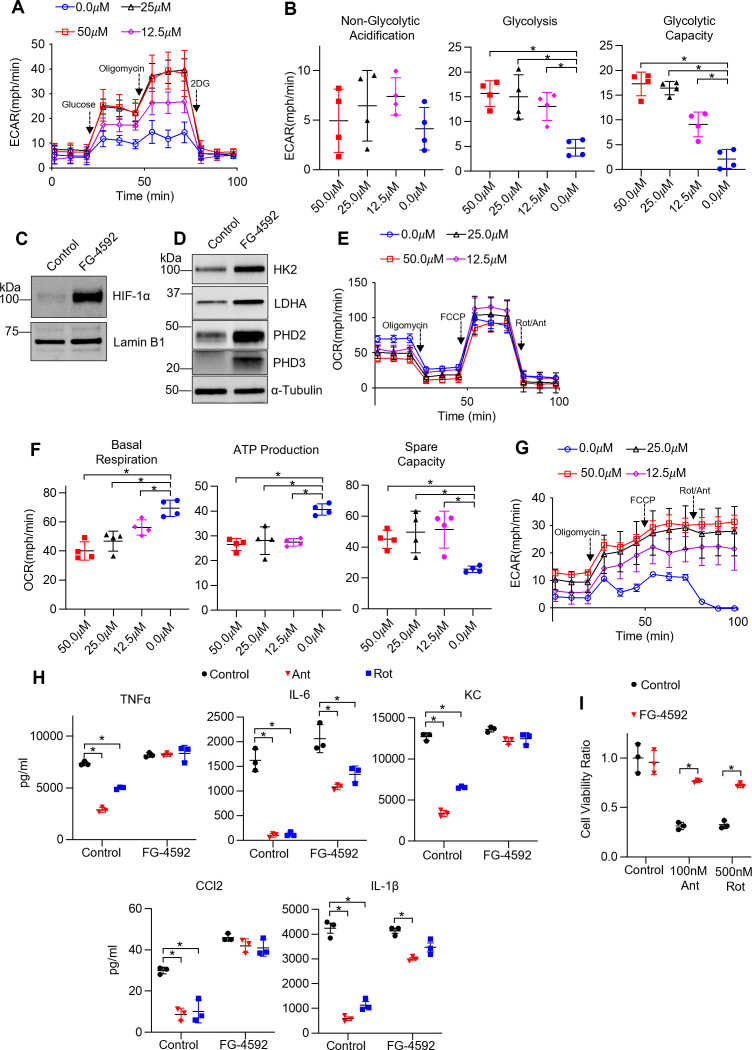
Figure 6. Non-hypoxic stabilization of hypoxia-inducible factor 1-alpha (HIF-1α) induces glycolysis and rescues ETC inhibitor-induced reduction in cytokine production and cell death in tissue-resident alveolar macrophages (TR-AMs).
TR-AMs were treated (16 hr) overnight ±FG-4592 (25.0 μM when not stated otherwise). (A) Glycolysis was measured as extracellular acidification rate (ECAR). (B) Quantification of glycolytic parameters. Data represent at least three independent experiments (n = 4 separate wells per group). Glycolytic parameters compared to control group (0.0 μM) and significance was determined by one-way ANOVA with Bonferroni correction. (C) Western blot analysis of nuclear extract for HIF1α expression and (D) whole cell lysate for glycolytic enzyme and prolyl hydroxylase expression. (E) Mitochondrial stress test to measure oxygen consumption rate (OCR). (F) Quantification of mitochondrial respiration parameters. Data represents at least three experiments (n = 4 separate wells per group). Mitochondrial parameters were compared to control group (0.0 μM) and significance was determined by one-way ANOVA with Bonferroni correction. (G) ECAR measurement during mitochondrial stress test. (H) TR-AMs were pretreated overnight (16 hr) with 0.0 μM (no treatment) or 25.0 μM FG-4592, then stimulated with 20 ng/ml lipopolysaccharide (LPS) in the presence or absence of mitochondrial inhibitors (20 nM antimycin A [Ant] or rotenone [Rot]) for 6 hr while maintaining pretreatment conditions. Sandwich ELISA was used to measure secreted cytokine (TNFα, IL-6, KC, and CCL-2). Data represents at least three independent experiments; n = 3 per group. (I) TR-AMs were treated with FG-4592 for 6 hr, then treated with mitochondrial inhibitors (100 nM Ant or 500 nM Rot) overnight and a sulforhodamine B assay was performed to measure cytotoxicity. Bar graphs represent cytotoxicity compared to control, 0.0 µM group. Data represents at least three independent experiments (n = 3 per group). Significance was determined by two-way ANOVA with Bonferroni correction. All error bars denote mean ± SD. *p<0.05.

