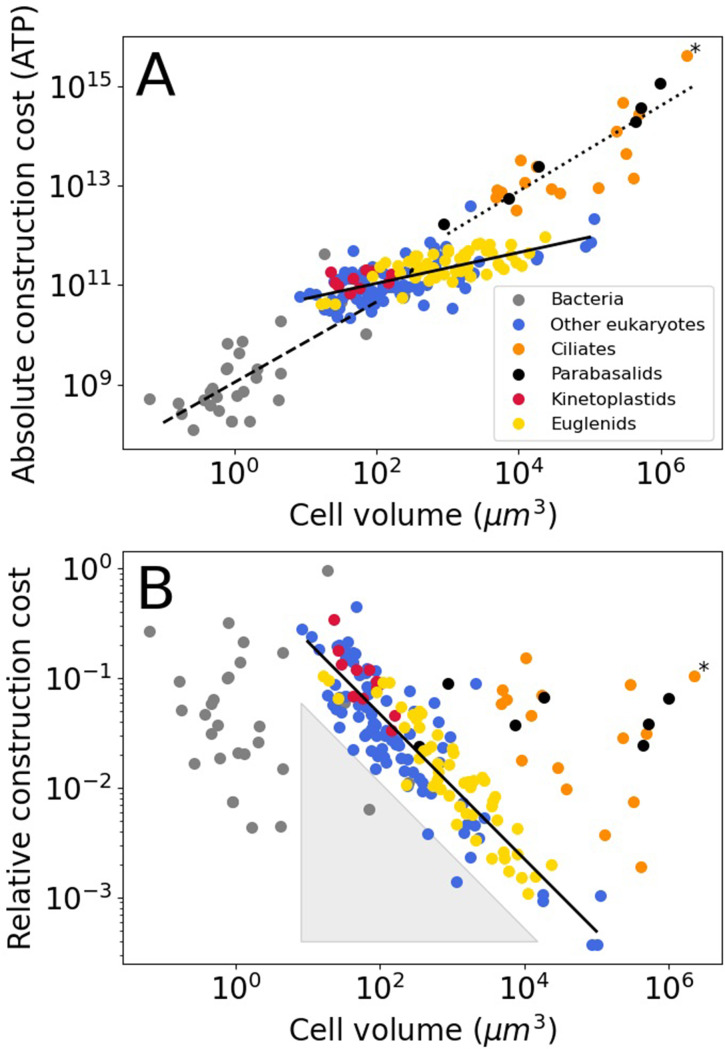
Figure 1. Construction costs of flagella in bacteria and eukaryotes as a function of cell volume.
Each point denotes a species. The costs are the sum over all flagella present on a single cell. (A) The absolute construction cost. The lines are power law fits to bacteria, eukaryotic flagellates (euglenids, kinetoplastids, and ‘other eukaryotes’), and ciliates and parabasalids. The equations are: , , and , respectively (exponent ± SE). (B) The construction costs of flagella relative to the construction costs of the entire cell. The line is a power law fit to the eukaryotic flagellates: . The grey-shaded triangle is explained in the Discussion. In both panels the asterisk marks Opalina ranarum, which resembles ciliates in its flagellar distribution but does not belong to the ciliate clade. Data in Figure 1—source data 1.


