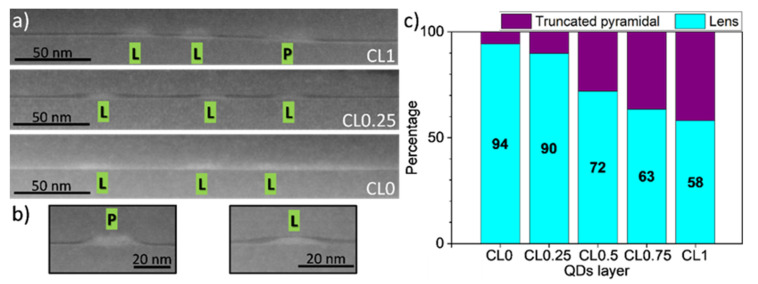
Figure 2.
(a) LAADF images of the layers CL1 (top), CL0.25 (middle) and CL0 (bottom). Lens and pyramidal-shaped dots are marked with L and P, respectively. The Al-rich CLs appear darker. (b) Zoom of a truncated pyramidal (left) and lenticular (right) QD capped with AlAs. (c) The proportion of lenticular and pyramidal QDs in the QD population for the different QDs layers.

