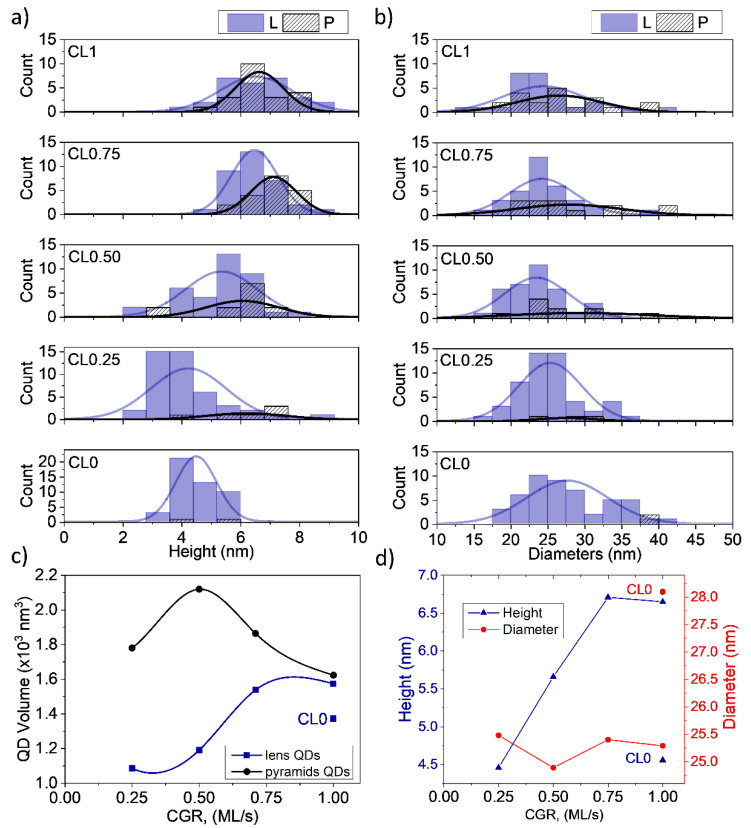
Figure 3.
Histograms of (a) QD height and (b) base diameter distributions for lens and truncated pyramidal geometries of the different QD layers. The differences in the distribution between the two geometries become smaller as the CGR increased. Arrows show the position of the mean values of lenticular (red) and pyramidal (black) QDs. (c) The volume of QDs for lenticular and truncated pyramidal-shaped QDs versus CGR. Both geometries show similar average volume for the fastest CGR. (d) Average height and diameter of QDs versus CGR. The sample without CL of AlAs (CL0) is not connected by lines.

