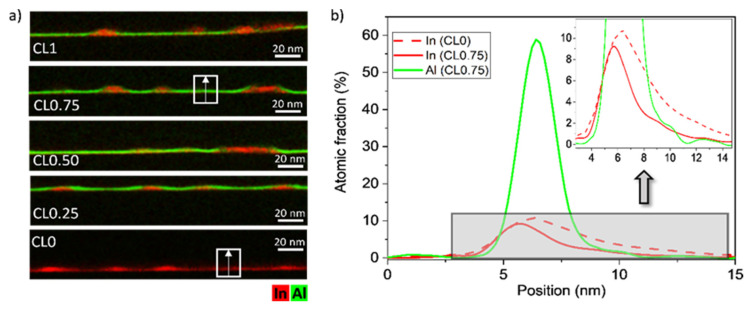
Figure 4.
(a) Elemental EDX maps of In and Al for the different QD layers. (b) Average compositional profiles of In (red) and Al (green) along the growth direction in the CL/WL regions of the QD layers CL0.75 and CL0. All the compositional profiles of the QD layers with CL of AlAs in the regions between dots are remarkably similar. The inset corresponds to a zoom of the gray region.

