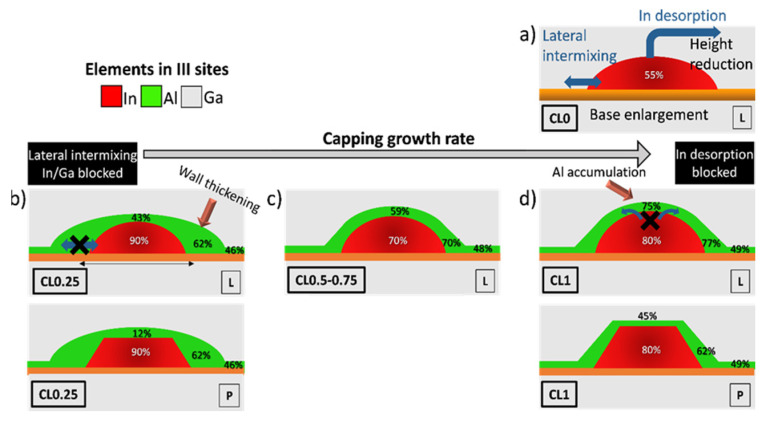
Figure 10.
Schematic representation of the CGR effects in the GaAs/InAs/AlAs QD system for a (a) QD capped with GaAs (CL0), (b) covered by AlAs at 0.25 ML/s (CL0.25), (c) 0.5–0.75 ML/s and (d) 1 ML/s (CL1). “L” and “P” at the bottom right in each picture designate the lens and truncated pyramidal geometries. Average compositions for the QDs and the CL are indicated.

