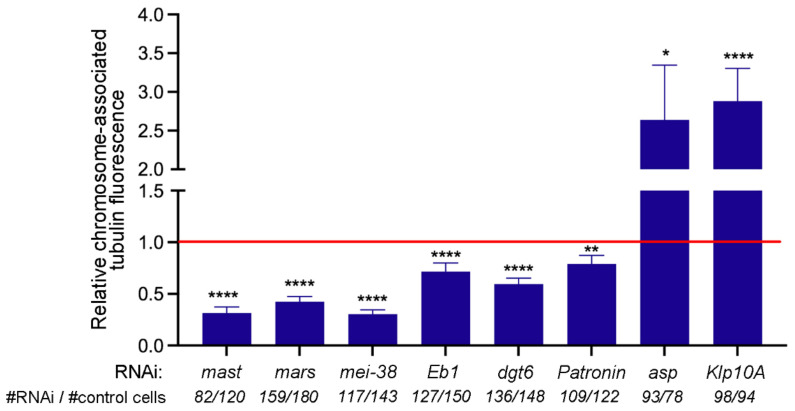
Figure 6.
Mean fold changes relative to control of the tubulin fluorescence intensity of cells showing kinetochore-driven microtubule regrowth (KDMTR). The mean fold changes (±SEM) of chromosome-associated tubulin fluorescence (CATF) relative to control (set to 1; red line) were determined by examining only PRO-METs that exhibit KDMTR. In all cases, except Klp10A RNAi, data are from at least three independent experiments; for Klp10A RNAi cells, data are from two independent experiments. The total numbers of RNAi and control PRO-METs (# RNAi cells/# control cells) examined for each experiment are indicated on the bottom of the graph. The data were analyzed with the Mann–Whitney U test; ns, not significant; *, **, **** significant with p ≤ 0.05, 0.01, and 0.0001, respectively.

