Figure 4.
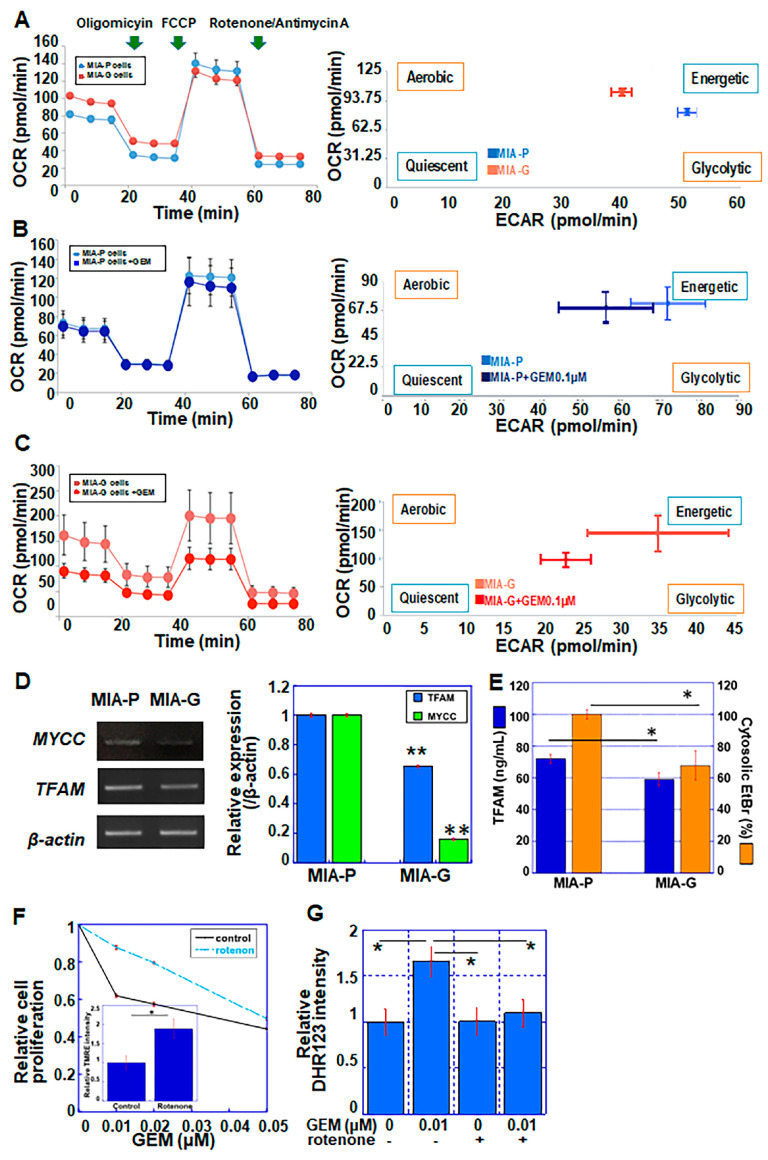
Mitochondrial respiration and metabolic profile of MIA-P and MIA-G cells. In flux analysis, 1.5 × 10⁴ cells were sequentially treated with oligomycin (2 μM), FCCP (1 μM) and rotenone/antimycin A (0.5 μM). (A) MIA-P and MIA-G cells under normal conditions. (B,C) Effect of GEM (0.1 μM) on mitochondrial respiration in MIA-P (B) and MIA-G (C) cells. (D) mRNA expression of MYCC and TFAM. (E) TFAM protein levels and cytosolic EtBr intensity (%) in MIA-P and MIA-G cells. (F) TMRE staining and GEM sensitivity in MIA-P cells with or without rotenone (0.002 μM). (G) Mitochondrial ROS production was assessed by DHR123 staining in MIA-P cells. Error bars represent the standard deviation from three independent evaluations. * p < 0.05, ** p < 0.01. MIA-P—MIA-PaCa-2; MIA-G—MIA-PaCa-GEM; OCR—oxygen consumption rate; ECAR—extracellular acidification; FCCP—4-trifluoro-methoxy-phenyl-hydrazone; GEM—gemcitabine; TFAM—mitochondrial transcription factor A; DHR—dihydrorhodamine; TMRE—tetramethylrhodamine ethyl ester; EtBr—ethidium bromide.

