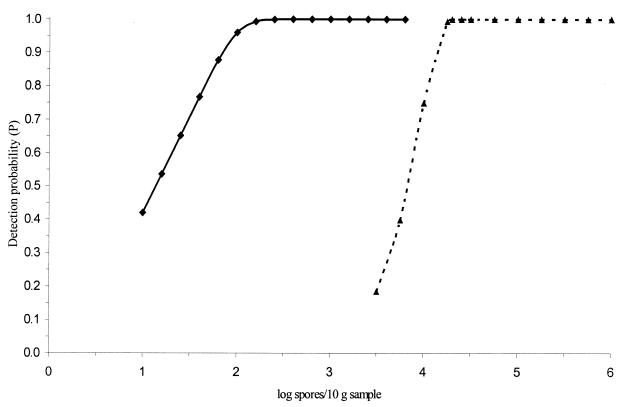
FIG. 2.
Detection probability curves of C. botulinum types B, E, and F at different spore concentrations in pig fecal samples after analysis with the combined selection and enrichment PCR procedure. P, no. of positive PCR results/no. of replicates tested; ♦, fecal homogenate (1:10 in TPGY broth) spiked with a serial dilution of C. botulinum type B spores (Eklund 2B and Eklund 17B) (n = 24); ▴, fecal homogenate (1:10 in TPGY broth) spiked with a serial dilution of C. botulinum type E and F spores (CB-S3-E and Craig 610B8-6F) (n = 24).

