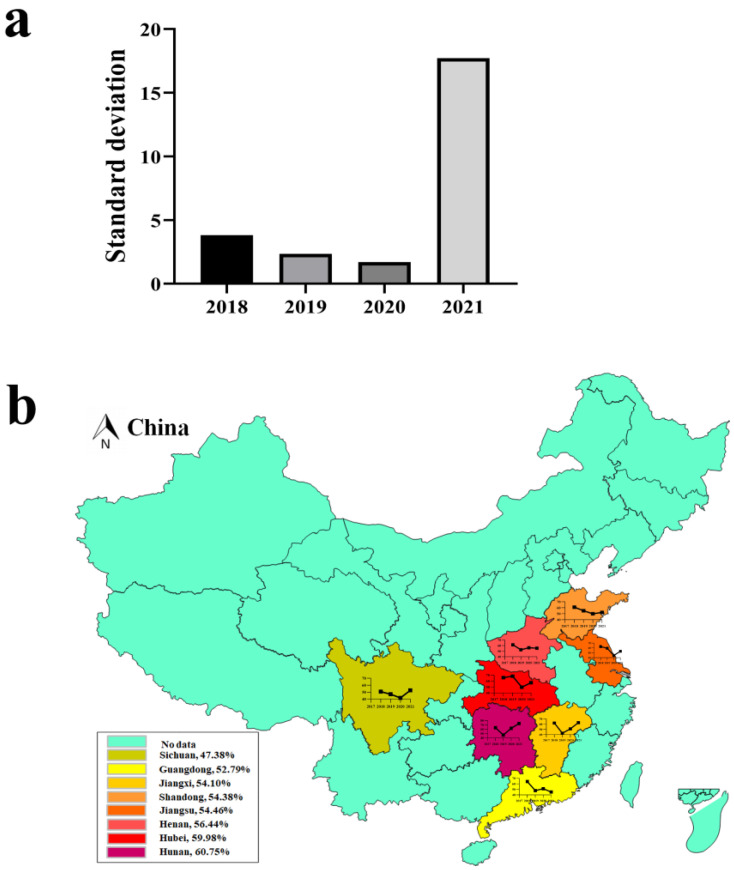
Figure 2.
Seasonal characteristics and distribution of PEDV. (a) The standard deviation of PEDV in samples collected in different seasons from 2018 to 2021. The X-axis represents the year, and the Y-axis represents the standard deviation of the PEDV positive rate in the four seasons from 2018 to 2021. (b) Distribution of PEDV detection rate in eight major pork-producing provinces of China from 2018 to 2021. The yellow area indicates a low positive rate from 2018 to 2021; the red area indicates the highly endemic areas; a darker color indicates a higher positive rate. Percentages represent the overall positive rate from 2018 to 2021. The histogram indicates the positive rate in each province, and the point indicates the positive rate of PEDV in that year (Note: the map does not represent the true borders of administrative regions of China).

