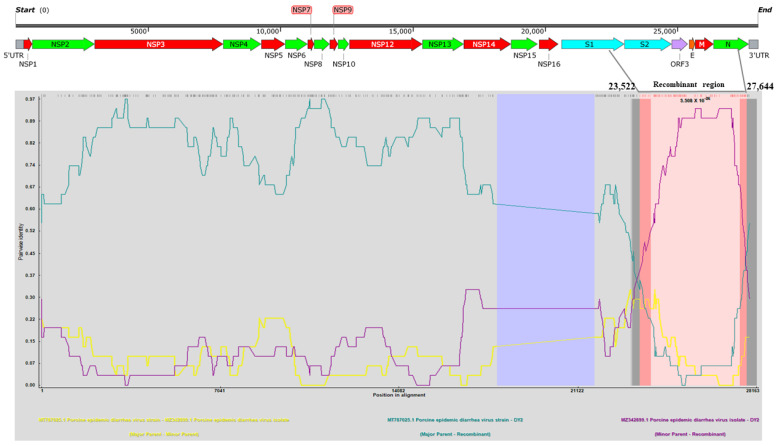
Figure 5.
The recombination analysis of the complete genome of PEDV DY2020 strains isolated in this study. The results were described using the RDP method, which was supported by ≥6 programs to further characterize the potential recombination events. The pink box indicates the regions for the occurrence of recombination events. The Y-axis represents the pairwise identity between the recombinant and its putative parents. The X-axis represents the position in alignment with a 30 nt sliding window. The comparison of the recombinant-major parent, recombinant-minor parent, and major-minor parent was indicated by cyan, purple, and yellow lines, respectively.

