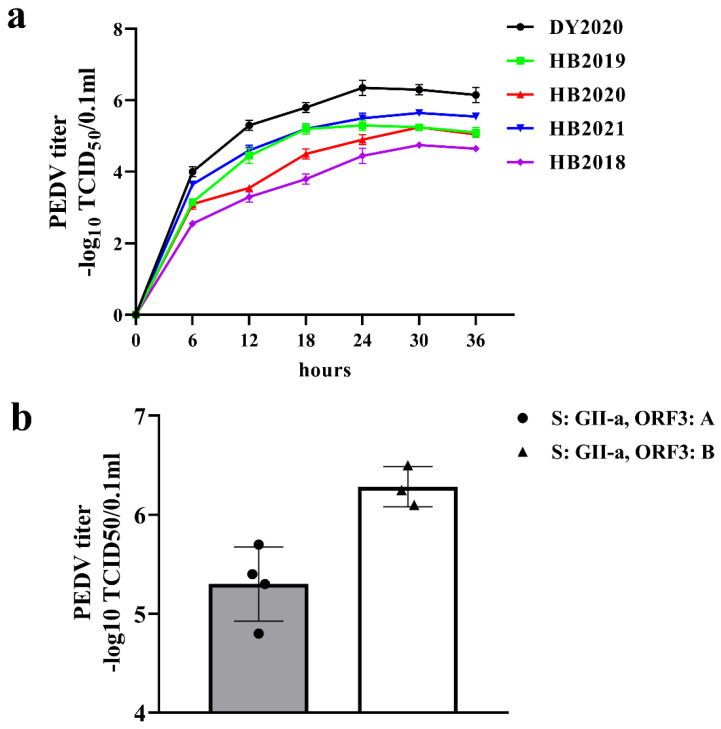
Figure 6.
The growth kinetics of isolated PEDV strains and titer analysis. (a) Growth curves of isolated PEDV strains in Vero cells. (b) The relationship between PEDV strain titer and ORF3 gene clustering. The dots represent HB2018, HB2019, HB2020, and HB2021 strains, and the triangles represent DY2020, HM2017, and CH/HLJ/18 strains [23,24].

