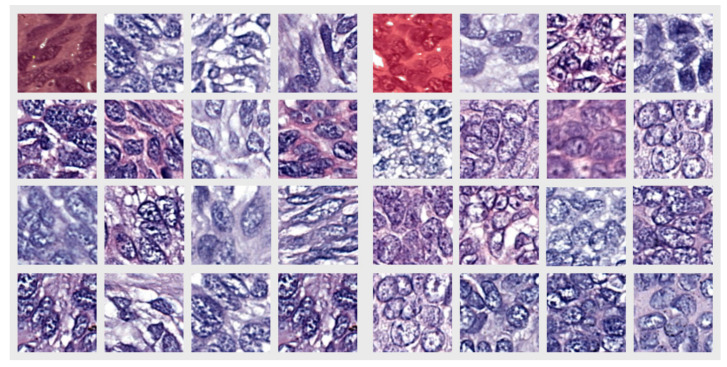
Figure 3.
Randomly selected crops from the T component dataset, where the network uniformly segmented the area with only the correct label. The left group represents the N subtype and the right group represents the MN subtype. The first image of each group with overlaid labels represents samples from the nodule in Figure 2D.

