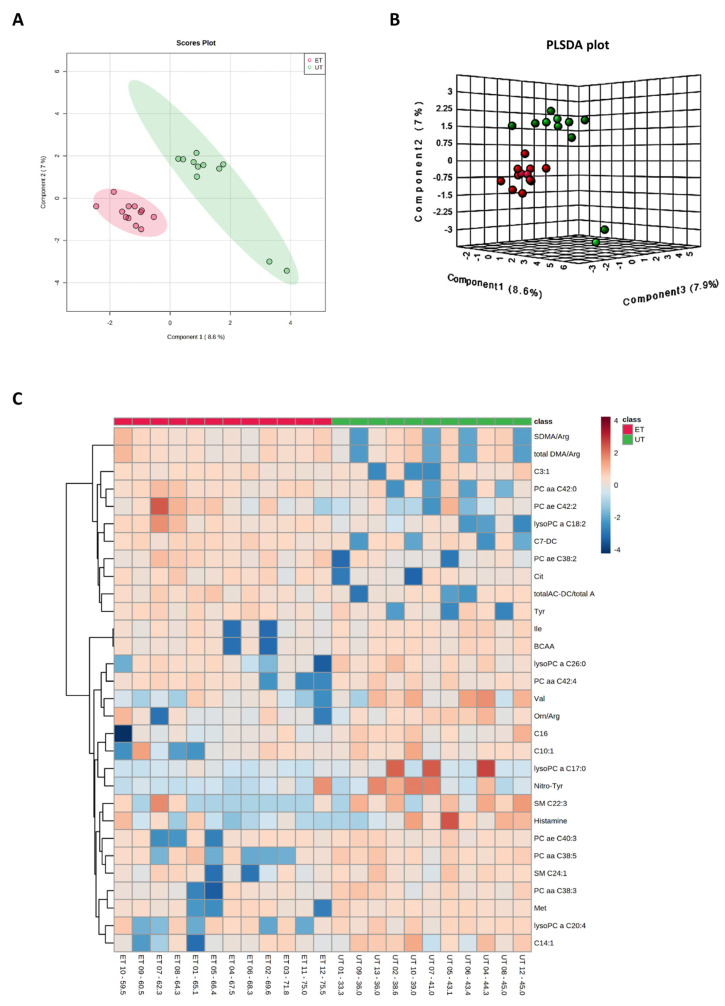
Figure 3.
Component and heat map analyses of metabolites detected by the Biocrates Absolute IDQ p180 kit. (A) 2D principal component analysis (PCA) scores plot displaying individual samples from both groups, i.e., from ET (pink) and UT (green) subjects. (B) 3D multiple component partial least squares discriminant analysis (PLSDA) plot showing individual samples from both groups, i.e., from ET (red) and UT (green) subjects. (C) The heat map only shows the top 30 deregulated metabolites or ratios as listed on the vertical dimension. Metabolites with high plasma levels are highlighted in orange to red while under-represented metabolites are colored in light to dark blue. Therefore, raw data, i.e., metabolites´ concentrations, had to be normalized by their median and log2-transformed prior horizontal arrangement according to their group affiliation with increasing relative VO2max. Samples from ET athletes are located on the left side with red labels, and samples from UT subjects can be identified by their green labels.

