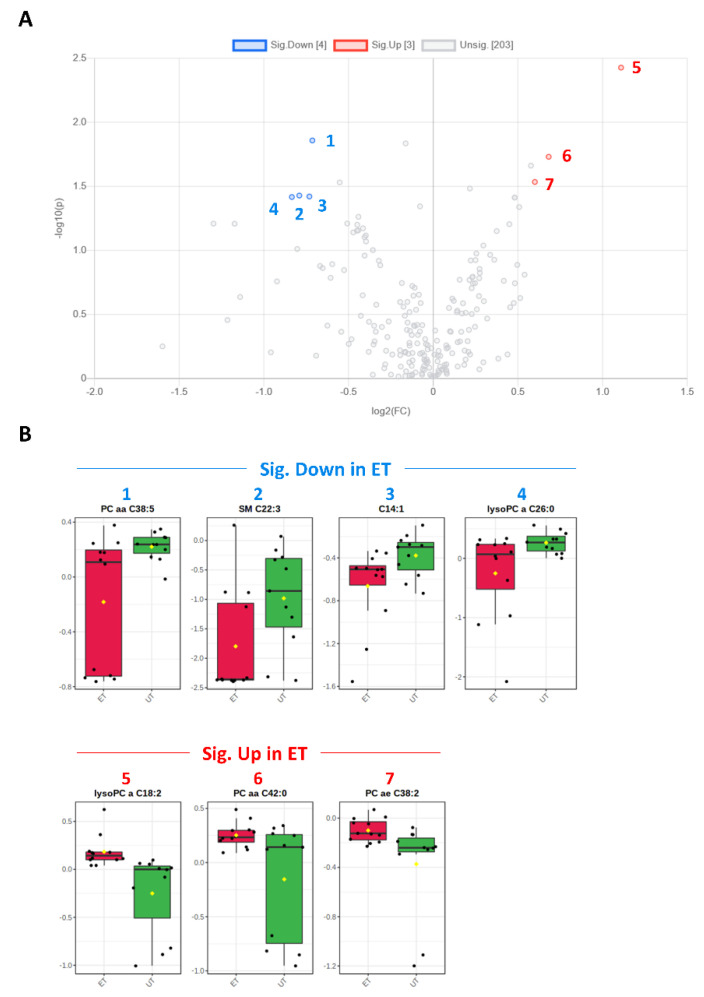
Figure 4.
Volcano and box plots for significant hits as determined by the Biocrates Absolute IDQ p180 kit. (A) An unpaired fold change (FC) analysis was conducted to compare the absolute value of change between both groups. Therefore, the respective group means for each metabolite plasma concentration before data normalization have been used to calculate the fold change as well as the log2(FC) for the ratio of ET to UT, which is reflected by the x-axis. Simultaneous presentation of the value for −log10(p) value on the y-axis in the volcano plot enables easy detection of strongly and significantly deregulated candidates when p ≤ 0.05 during the unpaired, parametric t-test (e.g., −log10(p) ≥ 1.3). Metabolites that are significantly down-regulated in ET athletes (by a threshold of 1.5 set as minimum for the fold change) are numbered in blue color (1–4) and the up-regulated are in red (5–7), respectively. (B) Box plots allow visualization of plasma metabolite concentrations [µM] on the single-sample level (marked with black dots) with the 95% confidence interval around the group’s median indicated by the notch and by a yellow diamond highlighting the group’s mean.

