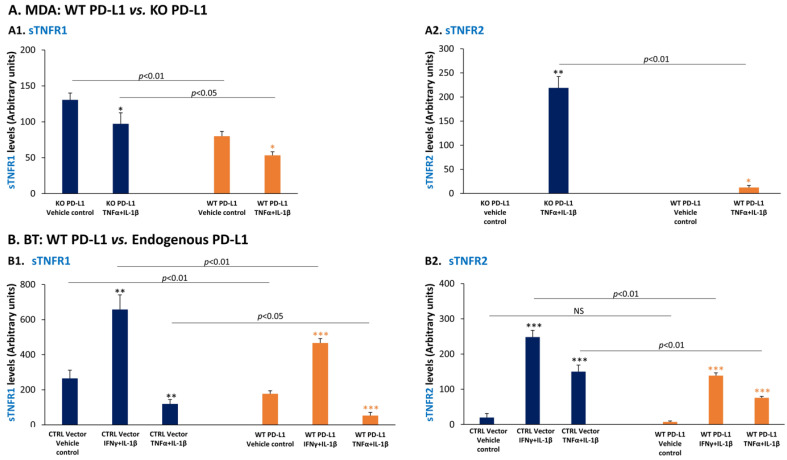
Figure 11.
In MDA-MB-231 and BT-549 cells, elevated PD-L1 levels lead to down-regulation of protective sTNFR1 and sTNFR2. (A) MDA-MB-231 cells (MDA) and (B) BT-549 cells (BT) were treated by pro-inflammatory cytokines or their vehicle control for 48–96 h, and the expression levels of cell-derived sTNFR1 (A1,B1) and of cell-derived sTNFR2 (A2,B2) in cell CM were determined by ELISA; sTNFR1 and sTNFR2 levels are presented as arbitrary units, derived from normalization of protein levels to cell numbers, due to higher proliferation rates of WT PD-L1-expressing cells compared to cells that did not express PD-L1 (“KO PD-L1” cells in MDA) or that expressed low endogenous PD-L1 levels (“CTRL Vector” cells in BT). (A) MDA cells included cells in which the endogenous expression of PD-L1 was KO by CRISPR-Cas9, and were then infected to express WT PD-L1 (termed “WT PD-L1” cells) or a vector control (“KO PD-L1” cells). Cells of both types were stimulated by TNFα + IL-1β (concentrations as in Figure 1) or treated by vehicle for 48 h. (A1) sTNFR1 levels. (A2) sTNFR2 levels. The expression levels of PD-L1 by MDA cells have been demonstrated in our published study [66] and are presented again for readers’ convenience in Figure S6A (a different experiment is presented in the current study than in [66]). (B) BT cells that expressed endogenous PD-L1 and were infected to over-express WT PD-L1 (“WT PD-L1” cells) were compared to control cells that were infected by a vector control and expressed endogenous, lower, PD-L1 levels (“CTRL Vector” cells). Cells of both types were stimulated by IFNγ + IL-1β (concentrations as in Figure 2) or by TNFα + IL-1β (concentrations as in Figure 1) for 72 h (in Part (B2)—for 96 h). Control cells were treated by vehicle. (B1) sTNFR1 levels. (B2) sTNFR2 levels. The expression levels of PD-L1 by BT cells are shown in Figure S6B (the current BT cells did not express mCherry, unlike the cells in [66]). In all panels, a representative experiment of n = 3 is presented. *** p < 0.001, ** p < 0.01, * p < 0.05. NS, not significant. Statistical analyses were performed as described in Section 2.

