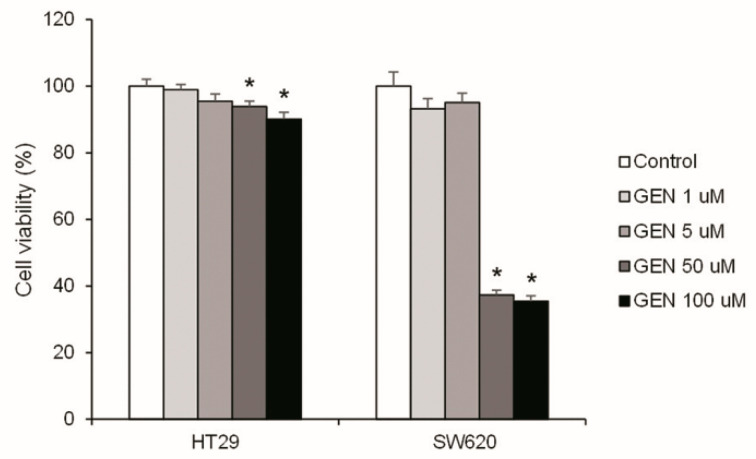
Figure 1.
Effects of different concentrations of genistein on cell viability in HT29 and SW620 cells, determined with Hoechst 33342 assay. The value of control cells (DMSO-treated cells) was set at 100%. The coordinate values represent cell viability (%) and the measurements were made with genistein 1, 5, 50, and 100 μM or 0.1% DMSO (control cells) treatment for 48 h. GEN, genistein. * Significant difference between control cells and genistein-treated cells (Student’s t-test; p < 0.05, n = 6).

