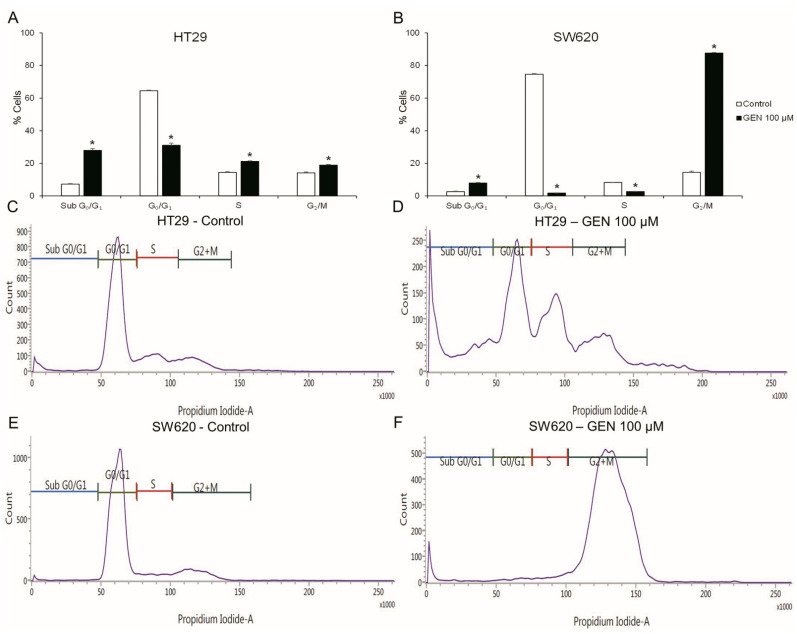
Figure 2.
Effects of genistein on cell cycle in (A) HT29 cells and (B) SW620 cells, determined by flow cytometry. Representative event count and propidium iodide fluorescence in HT29 cells (C,E) and SW620 cells (D,F). The measurements were made with 0.1% DMSO (control cells, (C,D)) or genistein 100 μM (E,F) treatment for 48 h. Values are expressed as mean ± SEM. GEN, genistein. * Significant difference between control cells and genistein-treated cells (Student’s t-test; p < 0.05, n = 6).

