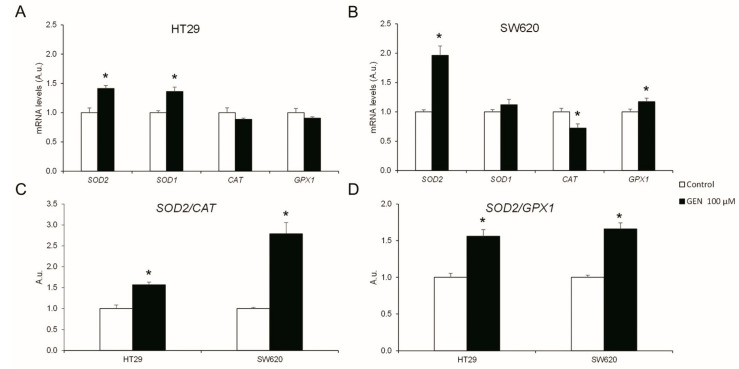
Figure 4.
Effects of genistein on antioxidant enzymes’ mRNA expression levels (SOD2, SOD1, CAT, and GPX1) in (A) HT29 cells and (B) SW620 cells determined by real-time PCR. Effects of genistein on mRNA expression levels ratios of (C) SOD2/CAT and (D) SOD2/GPX1 genes determined by real-time PCR. The measurements were made with genistein 100 μM or 0.1% DMSO (control cells) treatment for 48 h. The coordinate values represent mRNA levels (arbitrary units). Values are expressed as mean ± SEM and control values were set at 1.00. GEN, genistein; A.u., arbitrary units. * Significant difference between control cells and genistein-treated cells (Student’s t-test; p < 0.05, n = 6).

