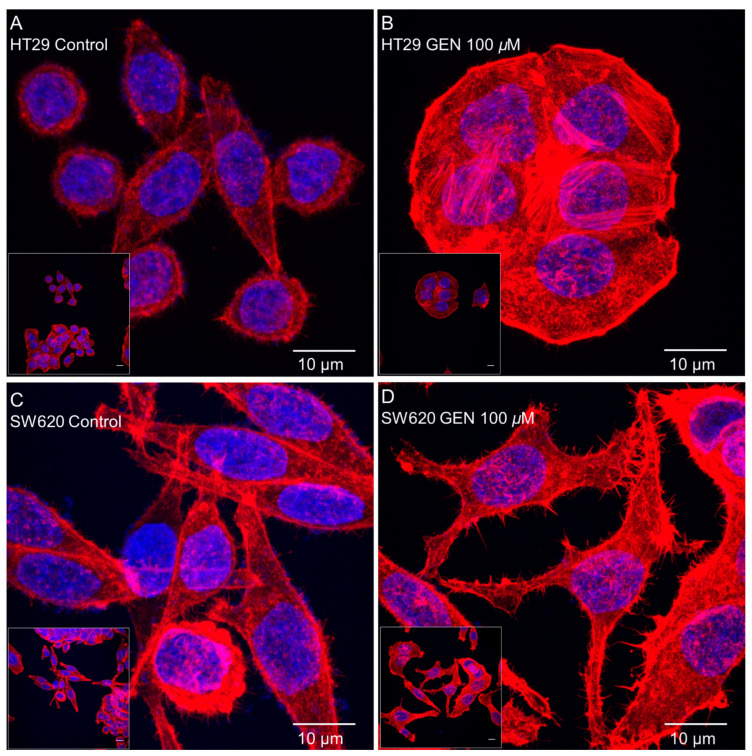
Figure 6.
Effects of genistein on actin cytoskeleton in (A,B) HT29 cells and (C,D) SW620 cells, determined by Phalloidin staining. The measurements were made with 0.1% DMSO (control cells, (A,C)) or genistein 100 μM (B,D) treatment for 48 h. The fluorescence was monitored with a Leica TCS-SPE Confocal Microscope, using 63× immersion oil (147 N.A.) objective lens. Scale bar 10 μm. White square in the bottom left corner shows the whole field without zoom and the image in the center shows a zoom from the white square image. Nucleus and actin cytoskeleton are represented in the picture in blue and red, respectively.

