Figure 1.
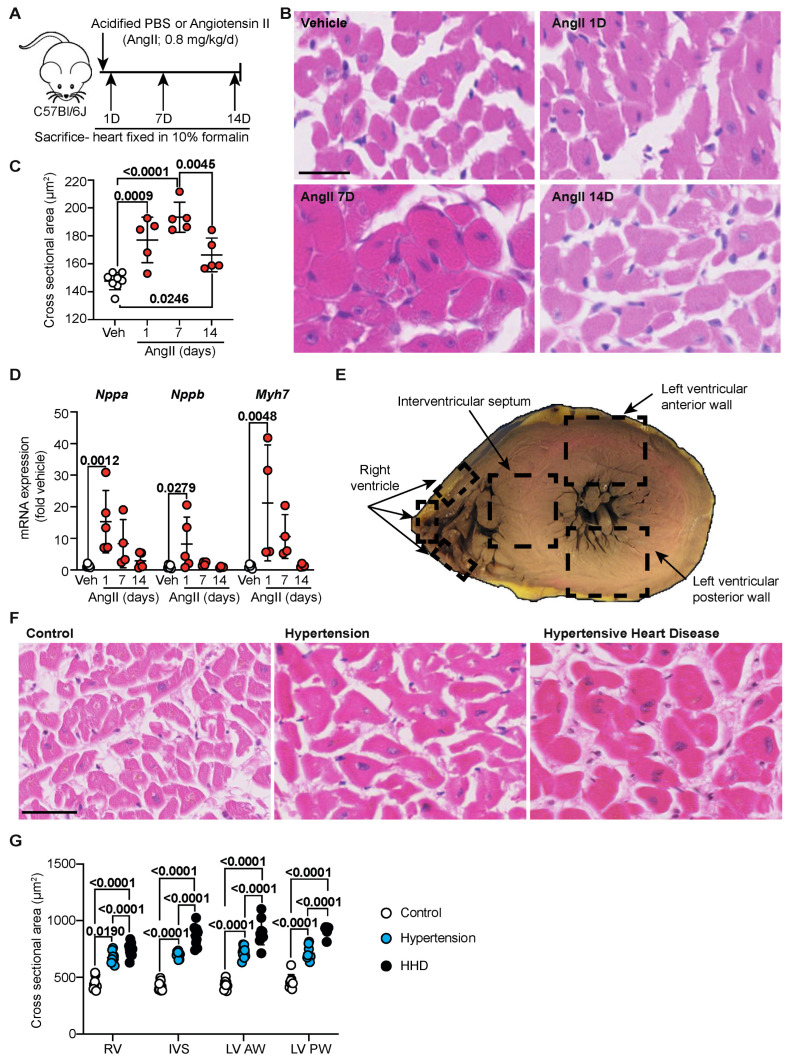
Cardiomyocyte hypertrophy is an acute phase in hypertension. (A) Schematic of hypertensive murine model. C57Bl/6J wild-type mice treated with either vehicle (Acidified PBS; n = 10) or Angiotensin II (AngII; 0.8 mg/kg/day) for 1 d, 7 d or 14 d (n = 4–5/group). (B) Representative images of murine heart sections stained with haematoxylin and eosin (H&E). Line represents 25 µm. (C) Quantification of murine cardiomyocyte cross-sectional area. Data are individual points with means ± SD. Stats: 1-way ANOVA with Holm–Sidak post-test. (D) Mouse cardiac RNA was isolated and mRNA expression of hypertrophy-associated genes determined by quantitative polymerase chain reaction. Data are individual points with means ± SD. Stats: 1-way ANOVA with Holm–Sidak post-test. (E) Schematic indicating regions of the human heart from which sections were taken for analysis. (F) Representative images of human left ventricular anterior wall stained with H&E. Line represents 50 µm. (G) Quantification of cross-sectional area of cardiomyocytes (control, n = 10; hypertension, n = 9; hypertensive heart disease, n = 10) across the whole human heart. Data are individual points with means ± SD. Stats: 1-way ANOVA with Holm–Sidak post-test. RV—right ventricle; IVS—interventricular septum; LV—left ventricle; AW—anterior wall; PW—posterior wall.

