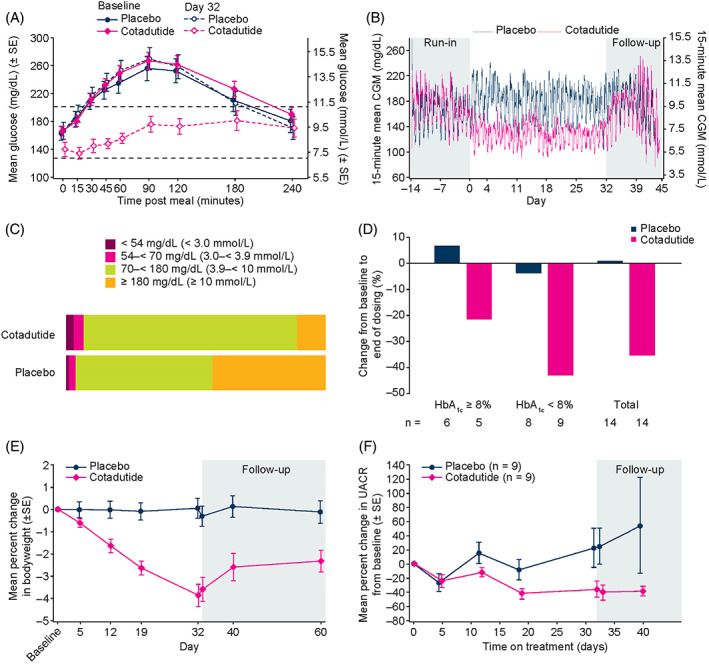
FIGURE 2.

Primary and secondary endpoints. (A) Percentage change in MMTT plasma glucose AUC4h from baseline to day 32. (B) 15‐minute mean CGM over time. (C) Proportion of time spent in target interstitial glucose range across 32 days of dosing. (D) Change from baseline to end of dosing in daily insulin dose in participants receiving insulin ≥20 units per day, according to baseline HbA1c (n = 14 in each treatment arm). (E) Percentage change in bodyweight from baseline to day 32 and over 38 days follow‐up. (F) Mean percentage change in UACR over time in subgroup of patients with baseline micro‐ or macroalbuminuria (n = 18). Abbreviations: AUC, area under the curve; CGM, continuous glucose monitoring; HbA1c, glycated haemoglobin; MMTT, mixed‐meal tolerance test; SE, standard error; UACR, urinary albumin‐to‐creatinine ratio
