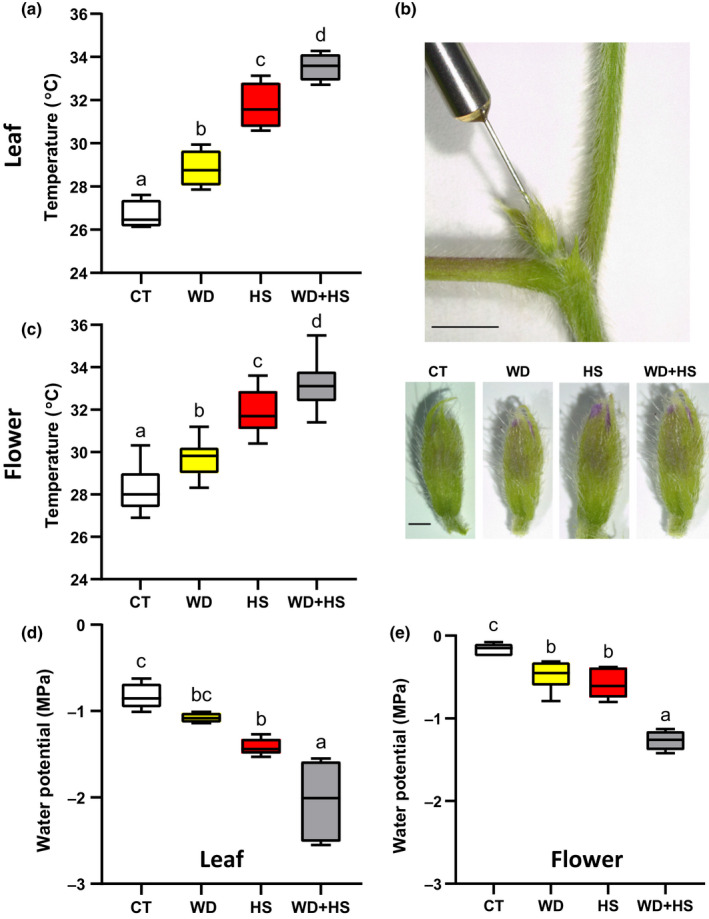
Fig. 1.

Leaf and flower temperature of soybean (Glycine max) plants subjected to a combination of water deficit (WD) and heat stress (HS). (a) Leaf temperature of soybean plants subjected to control (CT), HS, WD or WD + HS conditions. (b) Representative image of the experimental setup used to measure soybean inner flower temperature with a thermocouple thermometer probe (upper panel; bar, 5 mm) and representative images of closed (stages II and III; Supporting Information Fig. S1) soybean flowers developing under the different stress treatments (lower panel; bar, 1 mm). (c) Inner flower temperature of soybean flowers from plants subjected to CT, WD, HS or WD + HS. (d) Water potential (Ψ; psi, measured in MPa) of soybean leaves subjected to CT, WD, HS or WD + HS. (e) Water potential of soybean flowers from plants subjected to CT, WD, HS or WD + HS. All experiments were conducted with three biological repeats, each with 15 plants as technical repeats. Results are shown as box‐and‐whisker plots with borders corresponding to the 25th and 75th percentiles of the data. Different letters denote significance at P < 0.05 (ANOVA followed by a Tukey's post hoc test).
