
Fig. 5.
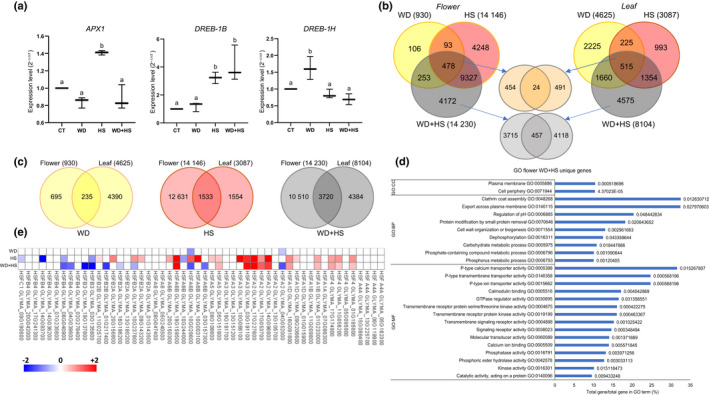
RNA‐seq analysis of soybean (Glycine max) flowers subjected to a combination of water deficit and heat stress. (a) Quantitative reverse transcription polymerase chain reaction (RT‐qPCR) analysis of ascorbate peroxidase 1 (APX1), and dehydration‐responsive element binding (DREB) 1B and 1H in flowers from plants subjected to control (CT), heat stress (HS), water deficit (WD) or WD + HS. Different letters denote significance at P < 0.05 (ANOVA followed by a Tukey's post hoc test). (b) Venn diagrams showing the overlap between transcripts with significantly altered expression (up‐ or downregulated) in flowers (left) and leaves (right) in response to HS, WD or WD + HS. Overlap between transcripts common to all stresses in leaves and flowers is shown in the upper middle and overlap between transcripts unique to WD + HS in flowers and leaves is shown in the lower middle. (c) Venn diagrams showing the overlap between transcripts with significantly altered expression (up‐ or downregulated) in flower and leaves in response to HS, WD or WD + HS. (d) Gene ontology (GO) enrichment analysis of transcripts unique to WD + HS in flowers (4177). (e) Heat map showing the expression pattern of all heat shock transcription factors (HSFs) in flowers subjected to HS, WD or WD + HS. Analysis was performed in three biological repeats. For each biological repeat 30–40 different flowers, and 15–20 different leaves, at the same developmental stage were pooled from eight to 10 different plants. All transcripts shown are significant at P < 0.05 (negative binomial Wald test followed by Benjamini–Hochberg correction). RT‐qPCR results are shown as box‐and‐whisker plots with borders corresponding to the 25th and 75th percentiles of the data. APX, ascorbate peroxidase.