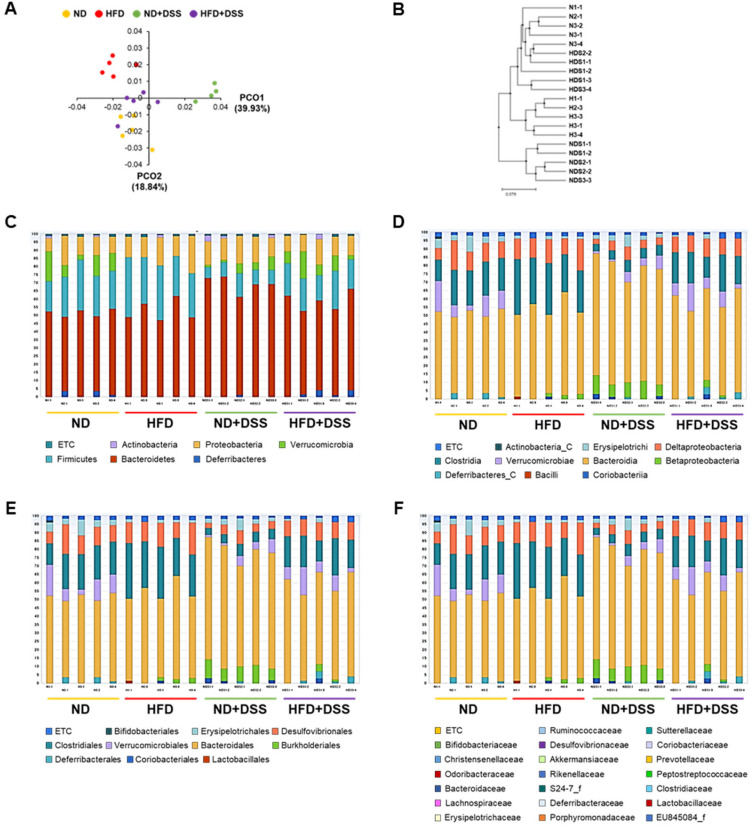
Figure 4.
Effects of HFD feeding on gut microbiota diversity and taxonomic composition. (A) Multiple sample PCoA. (B) Multiple-sample UPGMA clustering-similarity tree. Microbial community bar plot by phylum (C), class (D), order (E), and family (F). N, samples of ND; H, samples of HFD; NDS, samples of ND+DSS; HDS, samples of HFD+DSS; ND, normal diet; HFD, high-fat diet; ND+DSS, normal diet + dextran sulfate sodium; HFD+DSS, high-fat diet + DSS (n = 5/group); PCoA, principal coordinate analysis; UPGMA, unweighted pair-group method with arithmetic mean.

