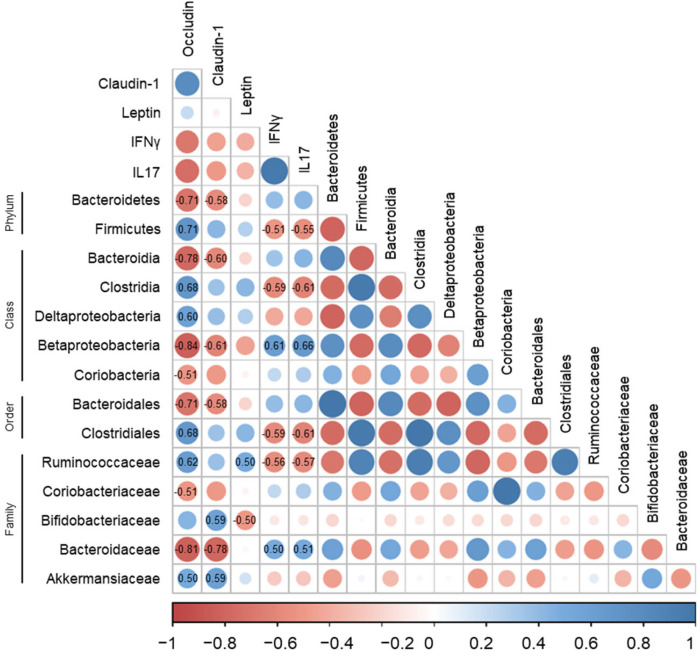
Figure 6.
Correlation of gut microbiota with immune-response markers and tight-junction proteins in DSS-induced colitis. Positive and negative correlations are represented in blue and red, respectively. Color intensity and size of the dots are proportional to the correlation coefficients. Correlation values with p < 0.05 are indicated within the box.

