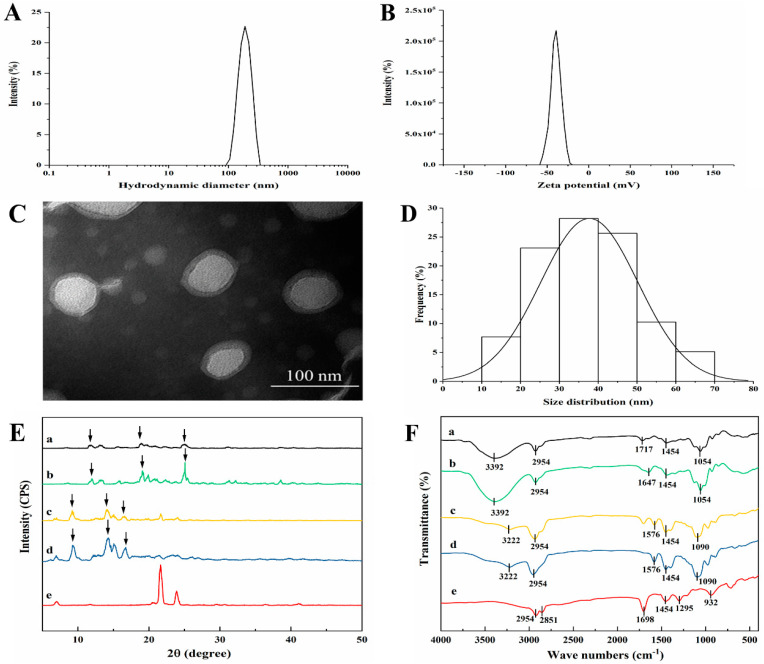
Figure 3.
Characterization of the optimized MAD–NLCs. (A) Hydrodynamic diameter (HD) and (B) zeta potential (ZP) of the MAD–NLCs were determined by DLS. (C) The morphology of the MAD–NLCs was observed by TEM, and (D) the size distribution was obtained via analysis of the particles from several TEM images. (E) XRD patterns and (F) FTIR spectra for (a) MAD–NLCs, (b) blank NLCs, (c) the physical mixture, (d) MAD, and (e) SA were shown.

