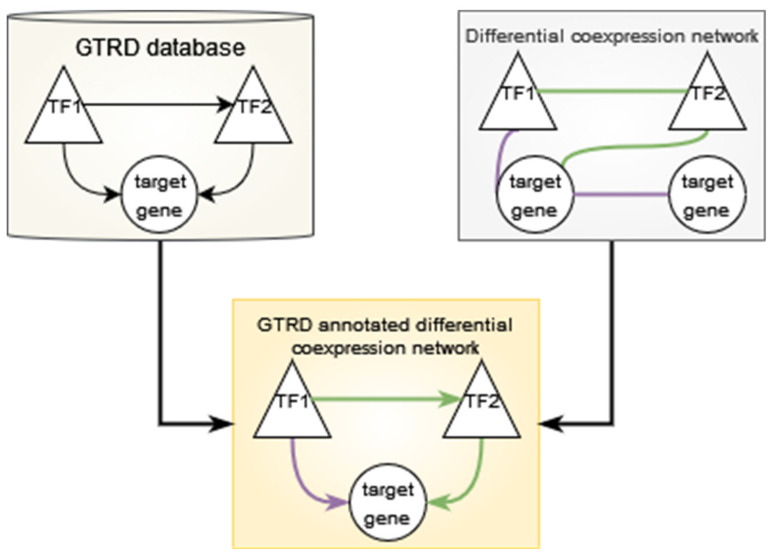
Figure 2.
Construction of the GTRD-annotated differential co-expression network. The GTRD database contains transcription factors (triangles) and target genes (circles). The presence of a binding site for the transcription factor in the promoter region of the target gene is shown by an arrow pointing from the transcription factor (TF) to the target gene. A TF–TF interaction is also shown. The differential co-expression network has gene pairs that show significantly increased edge weights (purple connector) or significantly decreased edge weights (green connector) in the comparison. The connections are not directed (connector without arrow) and may occur between any two genes. The GTRD-annotated differential co-expression network has TF–TF edges or TF–target gene edges if the edge is present in both GTRD and the differential co-expression network. The direction for the edge is annotated using GTRD. Purple arrows show a TF–target gene or TF–TF interaction where the edge weight is increased, and green arrows show one where the edge weight is decreased. There are no target gene–target gene edges in this network.

