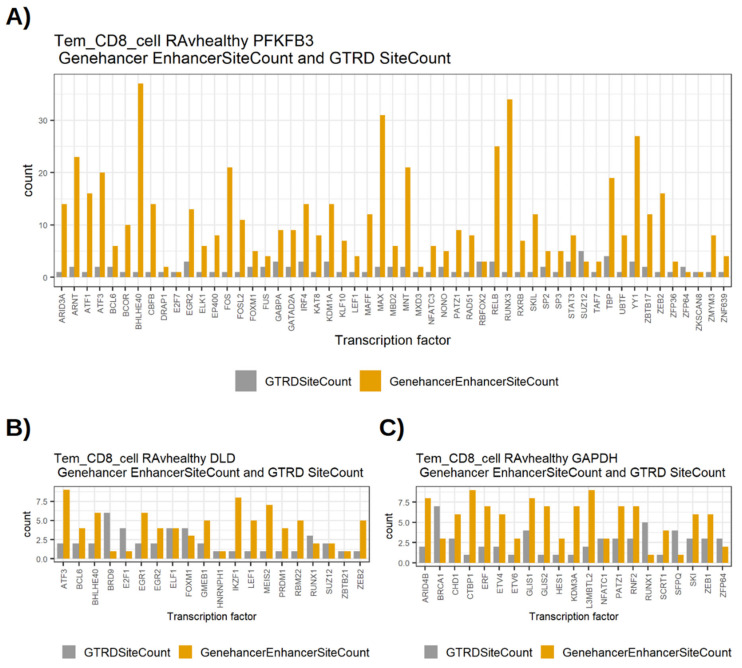
Figure 3.
Number of transcription factor binding sites for transcription factors that interact with PFKFB3, DLD or GAPDH, as annotated by GTRD and GeneHancer. Grey bars represent the number of TF binding sites in the interval −1000 to +100 around the transcription start site of the target gene according to GTRD. Yellow bars represent the number of TF binding sites outside the interval −1000 to +100 around the transcription start site of the target gene according to GeneHancer. (A) The transcription factors binding sites for PFKFB3, (B) The binding sites for DLD, (C) The binding sites for GAPDH.

