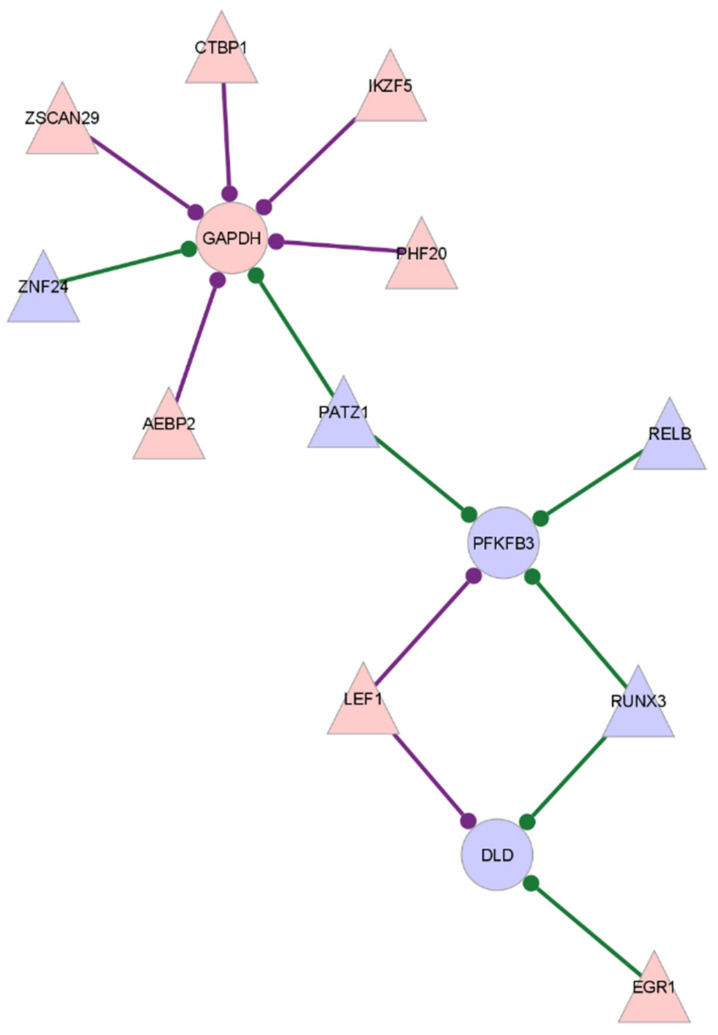
Figure 5.
Subgraph of differentially expressed glycolysis-related enzymes with high degree centrality in the GeneHancer-annotated network of edges with significantly different edge weights between untreated RA and healthy control samples, in CD8+ Tem cells. The differentially expressed transcription factors that link to the enzymes are shown. Triangles indicate transcription factors and circles indicate target genes. Node colour shows the direction of differential expression: red nodes are over-expressed and blue nodes are under-expressed. The presence of an edge between a TF and a target gene refers to a significant difference in the edge weights of that gene pair between untreated RA samples and healthy samples. Purple edges show higher edge weight in RA, and green shows higher edge weight in healthy samples.

