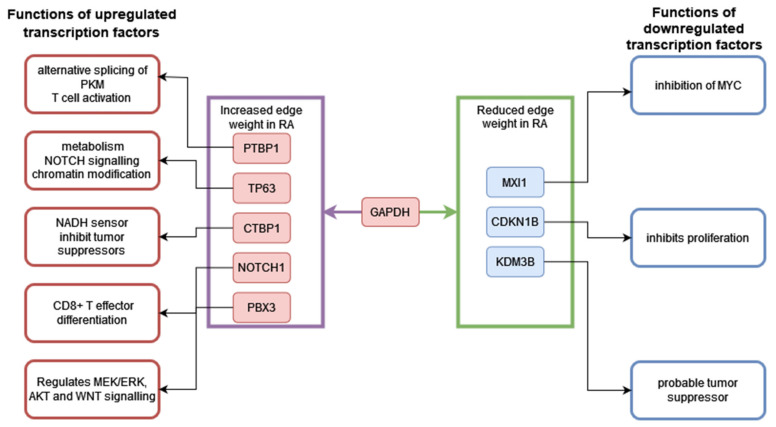
Figure 18.
Differentially expressed transcription factors which show differential co-expression with GAPDH in RA CD8+ Tem cells. Red boxes show genes that are upregulated, and blue boxes show those that are downregulated. The transcription factors with increased edge weights are shown in the purple box and those with reduced edge weights with GAPDH in RA are shown in the green box. The functions of each transcription factor are also shown.

