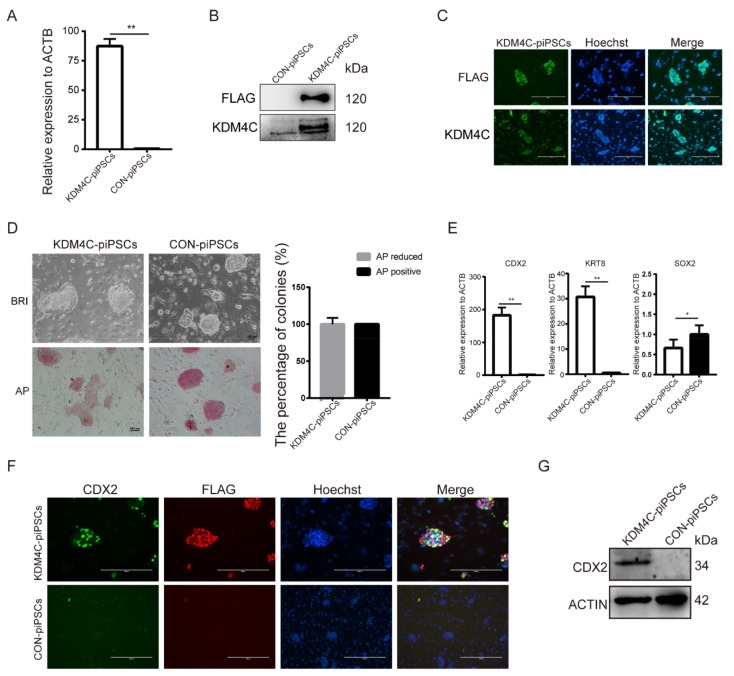
Figure 4.
KDM4C activated the expression of CDX2. (A) qRT-PCR analysis of KDM4C in CON- and KDM4C-overexpressing piPSCs (KDM4C-piPSCs); ** represents p < 0.001. (B) Western blot analysis of the KDM4C and FLAG expression level in the CON- and KDM4C-piPSCs; (C) immunofluorescence analysis of KDM4C and FLAG in the KDM4C-piPSCs; the scale bar represents 400 μm. (D) Representative image of bright-field and AP-stained colonies in the CON and KDM4C-piPSCs; the scale bar represents 100 μm. (E) qRT-PCR analysis of CDX2, KRT8 and SOX2 in E-piPSCs in the CON and KDM4C-piPSCs; ** represents p < 0.001, * represents p < 0.05. (F) Immunofluorescence analysis of CDX2 and FLAG level in the CON- and KDM4C-piPSCs; the scale bar represents 200 μm. (G) Western blot analysis of the CDX2 level in the CON- and KDM4C-piPSC.

